Introduction
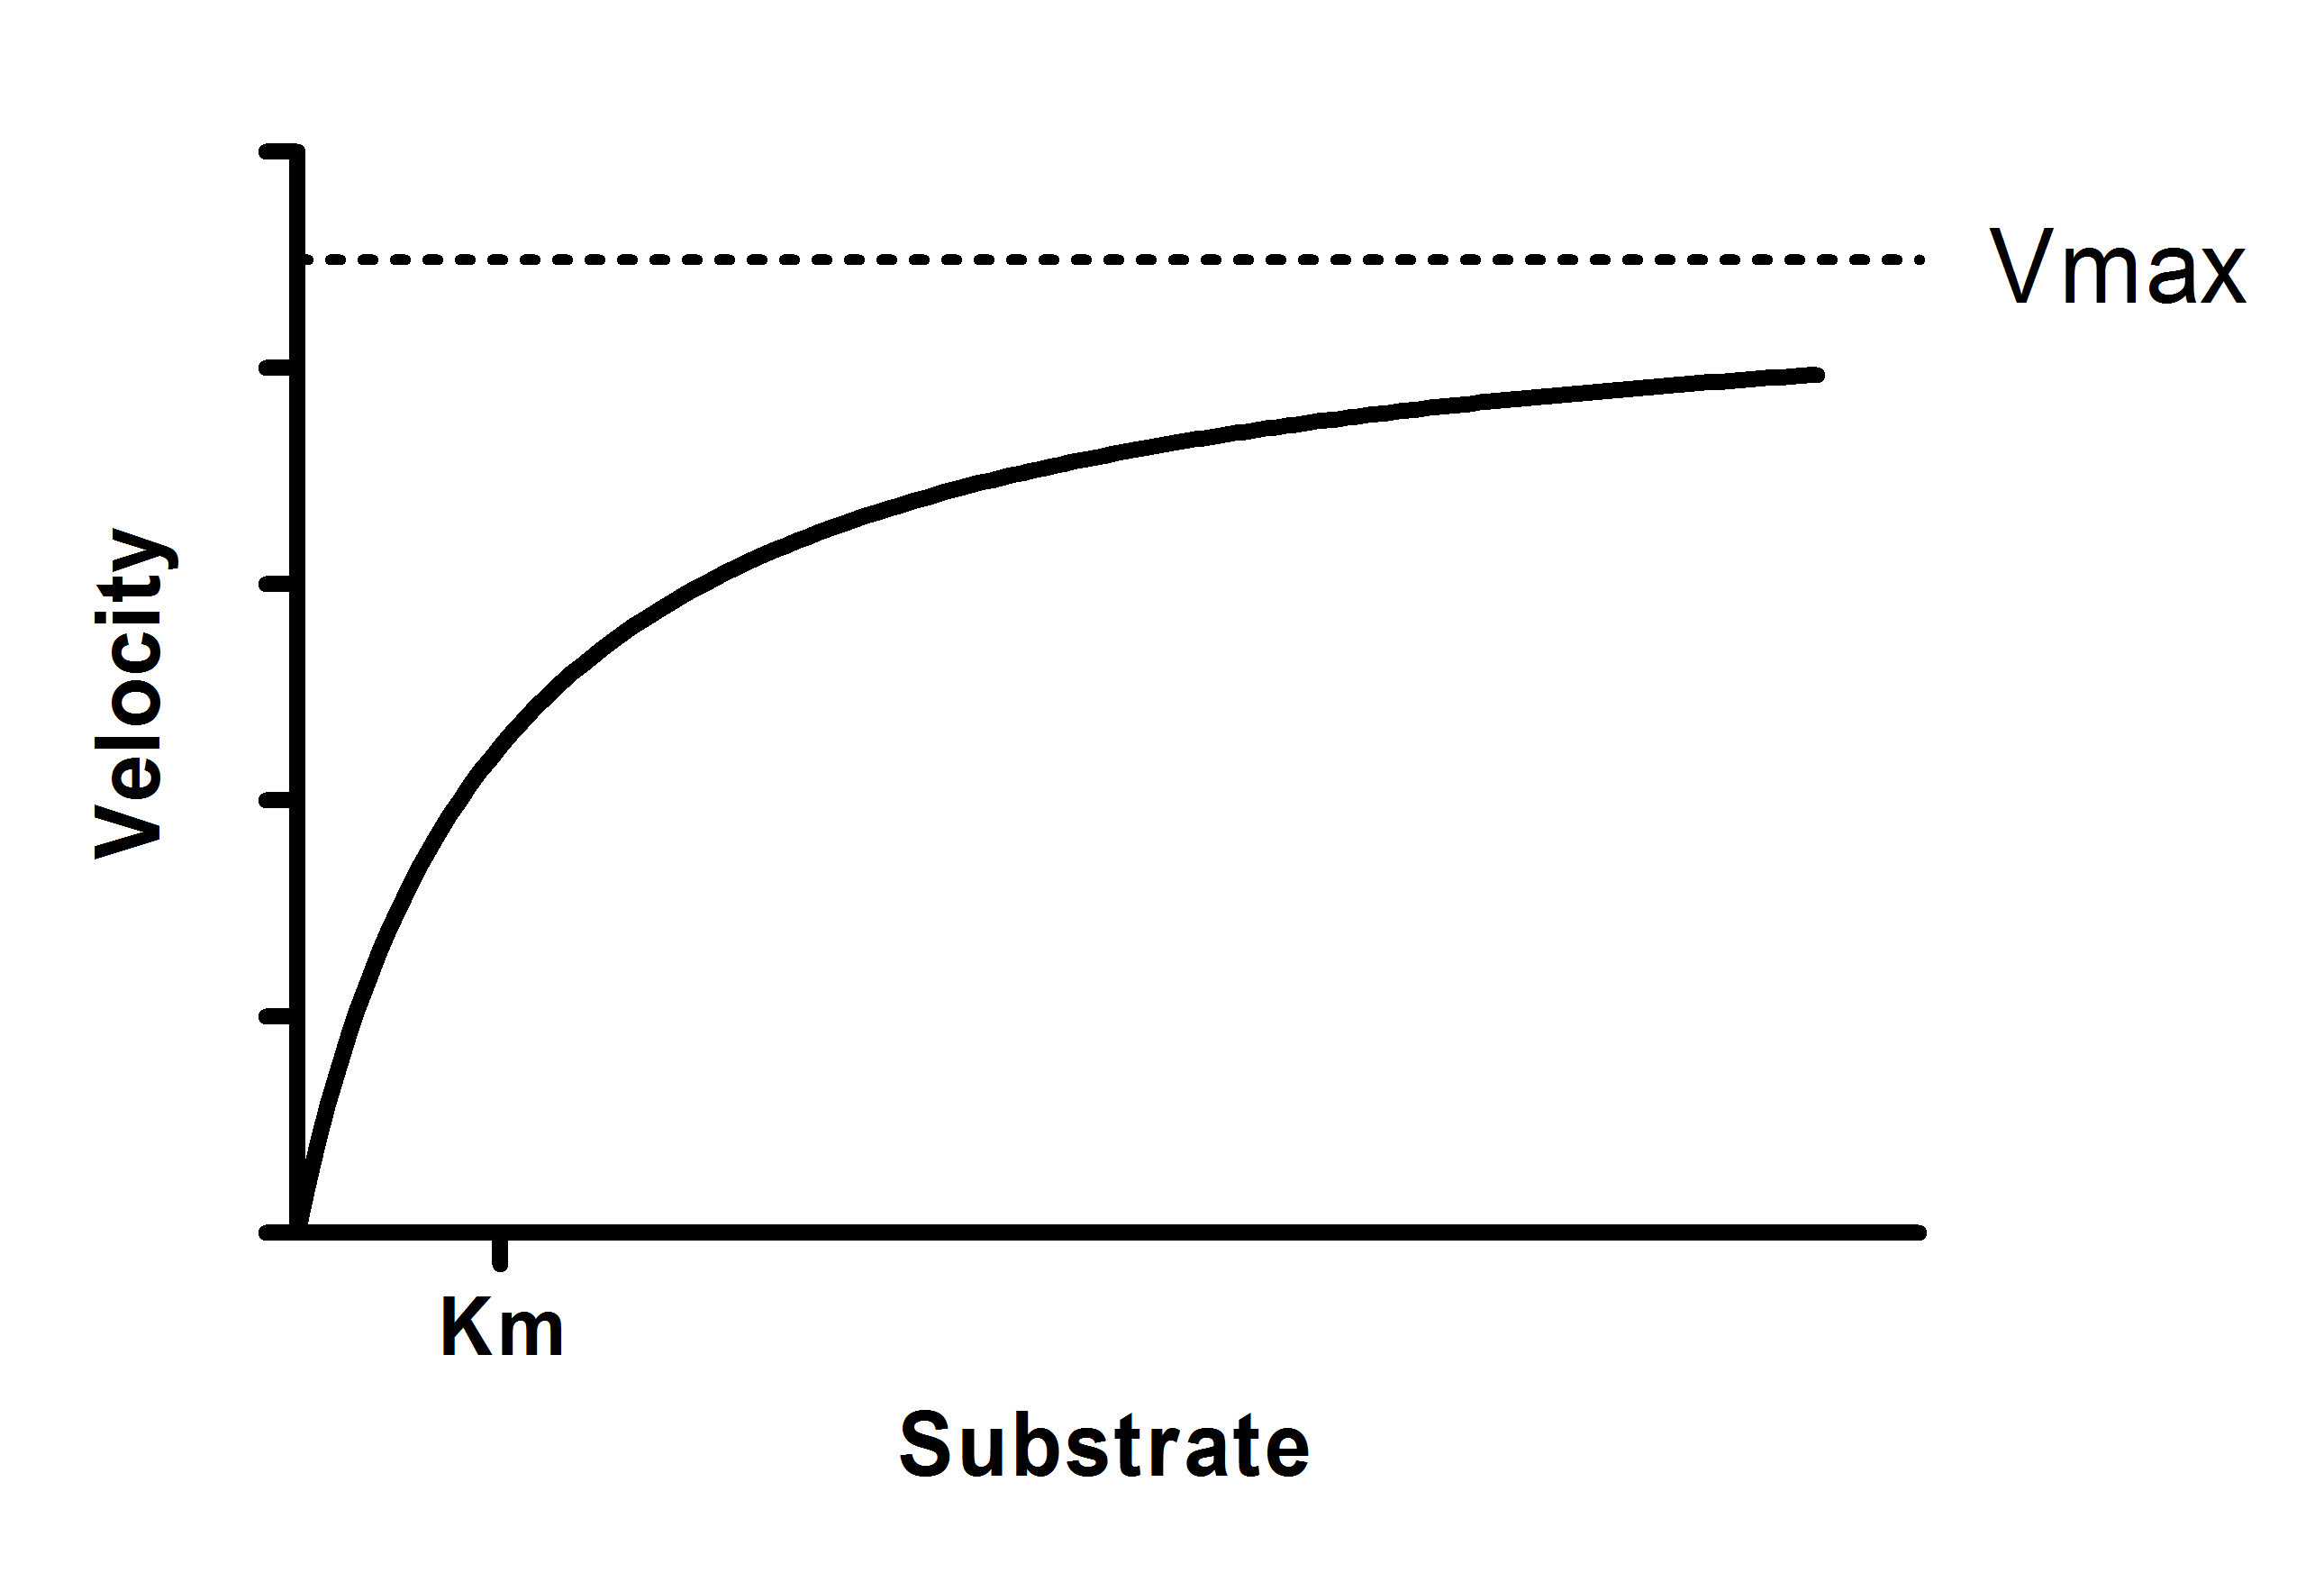
The most common kind of enzyme kinetics experiment is to vary the concentration of substrate and measure enzyme velocity. The goal is to determine the enzyme's Km (substrate concentration that yield a half-maximal velocity) and Vmax (maximum velocity). If your goal is to determine the turnover number kcat, rather than the Vmax, use an alternative version of the equation.
Step by step
Create an XY data table. Enter substrate concentration into X, and enzyme velocity into Y. If you have several experimental conditions, place the first into column A, the second into column B, etc.
You can also choose Prism's sample data: Enzyme kinetics -- Michaelis-Menten.
After entering data, click Analyze, choose nonlinear regression, choose the panel of enzyme kinetics equations, and choose Michaelis-Menten enzyme kinetics.
Model
Y = Vmax*X/(Km + X)
Interpret the parameters
Vmax is the maximum enzyme velocity in the same units as Y. It is the velocity of the enzyme extrapolated to very high concentrations of substrate, so its value is almost always higher than any velocity measured in your experiment.
Km is the Michaelis-Menten constant, in the same units as X. It is the substrate concentration needed to achieve a half-maximum enzyme velocity.
Create a Lineweaver-Burk plot
Before nonlinear regression was available, investigators had to transform curved data into straight lines, so they could analyze with linear regression. One way to do this is with a Lineweaver-Burk plot, which plots the reciprocal of substrate concentration vs. the reciprocal of enzyme velocity.
If you create a Lineweaver-Burk plot, use it only to display your data. Don't use the slope and intercept of a linear regression line to determine values for Vmax and Km. If you do this, you won't get the most accurate values for Vmax and Km. The problem is that the transformations (reciprocals) distort the experimental error, so the double-reciprocal plot does not obey the assumptions of linear regression. Use nonlinear regression to obtain the most accurate values of Km and Vmax.
To create a Lineweaver-Burk plot with Prism, use the Transform analysis, then choose the panel of biochemistry and pharmacology transforms.
To create a Lineweaver-Burke line corresponding to the nonlinear regression fit, follow these steps:
1.Create a new XY data table, with no subcolumns.
2.Into row 1 enter X=-1/KM, Y =0 (previously determined by nonlinear regression).
3.Into row 2 enter X=1/Smin (Smin is the smallest value of [substrate] you want to include on the graph) and Y=(1/Vmax)(1.0 + KM/Smin).
4.Note the name of this data table. Perhaps rename it to something appropriate.
5.Go to the Lineweaver-Burke graph.
6.Drag the new table from the navigator and drop onto the graph.
7.Double-click on one of the new symbols for that data set to bring up the Format Graph dialog.
8.Choose to plot no symbols, but to connect with a line.
Notes
•See the list of assumptions of all analyses of enzyme kinetics.
•This equation fits exactly the same curve as the equation that fits the turnover number Kcat rather than the Vmax. The product of Kcat times Et (the concentration of enzyme sites) equals the Vmax, so if you know Et, Prism can fit kcat.
•
•Note that Km is not a binding constant that measures the strength of binding between the enzyme and substrate. Its value takes into account the affinity of substrate for enzyme, and also the rate at which the substrate bound to the enzyme is converted to product.