Introduction
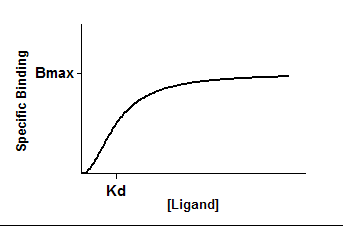
In a saturation binding experiment, you vary the concentration of radioligand and measure binding. The goal is to determine the Kd (ligand concentration that binds to half the receptor sites at equilibrium) and Bmax (maximum number of binding sites).
This equation assumes you have subtracted off the nonspecific, and are only analyzing specific binding.
This equation fits a Hill slope. If you assume the Hill slope is 1.0 (for mass action binding of a monomer to one site) use a simpler equation.
Step by step
Create an XY data table. Enter radioligand concentration into X, and specific binding into Y. If you have several experimental conditions, place the first into column A, the second into column B, etc.
An alternative approach would be to enter total binding into column A, and nonspecific into column B. Then use the Remove Baseline analysis to subtract column B from column A, creating a new results table with the specific binding.
From the table of specific binding, click Analyze, choose nonlinear regression, choose the panel of Saturation Binding equations, and choose Specific binding with Hill Slope.
Model
Y=Bmax*X^h/(Kd^h + X^h)
Note that the X axis is concentration, not log(concentration).
Interpret the parameters
Bmax is the maximum specific binding in the same units as Y. It is the specific binding extrapolated to very high concentrations of radioligand, and so its value is almost always. higher than any specific binding measured in your experiment.
Kd is the radioligand concentration needed to achieve a half-maximum binding at equilibrium, expressed in the same units as X. If h=1.0, this is the equilibrium binding constant. If h is not equal to 1.0, then the molecular interpretation of the Kd depends on why h is not 1.0.
h is the Hill slope. It equals 1.0 when a monomer binds with no cooperativity to one site. When it is greater than 1.0, you see a sigmoidal look to the graph as shown above. This happens when the receptor or ligand has multiple binding sites with positive cooperativity. The Hill slope is less than zero when there are multiple binding sites with different affinities for ligand or when there is negative cooperativity.
Note
Before version 7, this equation was called "One site -- specific binding with Hill slope". We removed "one site" from the name because if the Hill slope is not 1.0, this equation doesn't really describe binding to one site.