Review of the meaning of P value and alpha
Interpreting an individual P value is straightforward. Consider the simple case of comparing two means. Assuming the null hypothesis is true, the P value is the probability that random subject selection alone would result in a difference in sample means (or a correlation or an association...) at least as large as that observed in your study.
Alpha is a threshold that you set in advance. If the P value is less than alpha, you deem the comparison "statistically significant'. If you set alpha to 5% and if the null hypothesis is true, there is a 5% chance of randomly selecting subjects such that you erroneously infer a treatment effect in the population based on the difference observed between samples
Multiple comparisons
Many scientific studies test multiple hypotheses. Some studies can generate hundreds, or even thousands of comparisons.
Interpreting multiple P values is difficult. If you test several independent null hypotheses and leave the threshold at 0.05 for each comparison, the chance of obtaining at least one “statistically significant” result is greater than 5% (even if all null hypotheses are true). This graph shows the problem. The probability at least one "significant" comparison is computed from the number of comparisons (N) on the X axis using this equation: 100(1.00 - 0.95N).
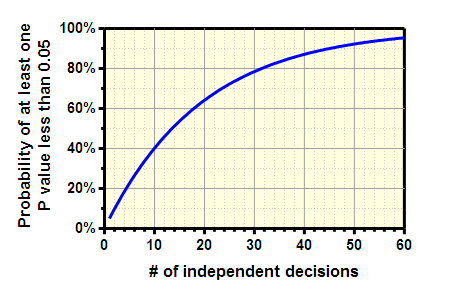
Remember the unlucky number 13. If you perform 13 independent comparisons, your chances are about 50% of obtaining at least one 'significant' P value (<0.05) just by chance.
The graph above (and the equation that generated it) assumes that the comparisons are independent. In other words, it assumes that the chance of any one comparison having a small P value is not related to the chance of any other comparison having a small P value. If the comparisons are not independent, it really is impossible to compute the probability shown the the graph.
Example
Let's consider an example. You compare control and treated animals, and you measure the level of three different enzymes in the blood plasma. You perform three separate t tests, one for each enzyme, and use the traditional cutoff of alpha=0.05 for declaring each P value to be significant. Even if the treatment doesn't actually do anything, there is a 14% chance that one or more of your t tests will be “statistically significant”.
If you compare 10 different enzyme levels with 10 t tests, the chance of obtaining at least one “significant” P value by chance alone, even if the treatment really does nothing, is 40%. Finally, imagine that you test 100 different enzymes, at 10 time points, with 12 pre treatments... If you don't correct for multiple comparisons, you are almost certain to find that some of them are 'significant', even if really all null hypotheses are true.
You can only correct for comparisons you know about
When reading a study, you can only account for multiple comparisons when you know about all the comparisons made by the investigators. If they report only “significant” differences, without reporting the total number of comparisons, it is not possible to properly evaluate the results. Ideally, all analyses should be planned before collecting data, and all should be reported.
Learn more
Multiple comparisons is a big problem, affecting interpretation of almost all statistical results. Learn more from a review by Berry (1), excerpted below, or from chapter 22 and 23 of Intuitive Biostatistics(2).
"Most scientists are oblivious to the problems of multiplicities. Yet they are everywhere. In one or more of its forms, multiplicities are present in every statistical application. They may be out in the open or hidden. And even if they are out in the open, recognizing them is but the first step in a difficult process of inference. Problems of multiplicities are the most difficult that we statisticians face. They threaten the validity of every statistical conclusion. " (1)
1.Berry, D. A. (2007). The difficult and ubiquitous problems of multiplicities. Pharmaceutical Statistics , 6, 155-160
2. Motulsky, H.J. (2010). Intuitive Biostatistics, 3rd edition. Oxford University Press. ISBN=978-0-19-994664-8.