Two-way ANOVA determines how a response is affected by two factors. For example, you might measure a response to three different drugs in both men and women.
Source of variation
Two-way ANOVA divides the total variability among values into four components. Prism tabulates the percentage of the variability due to interaction between the row and column factor, the percentage due to the row factor, and the percentage due to the column factor. The remainder of the variation is among replicates (also called residual variation).
These values (% of total variation) are called standard omega squared by Sheskin (equations 27.51 - 27.53, and R2 by Maxwell and Delaney (page 295). Others call these values eta squared or the correlation ratio.
ANOVA table
The ANOVA table breaks down the overall variability between measurements (expressed as the sum of squares) into four components:
•Interactions between row and column. These are differences between rows that are not the same at each column, equivalent to variation between columns that is not the same at each row.
•Variability among columns.
•Variability among rows.
•Residual or error. Variation among replicates not related to systematic differences between rows and columns.
The ANOVA table shows how the sum of squares is partitioned into the four components. Most scientists will skip these results, which are not especially informative unless you have studied statistics in depth. For each component, the table shows sum-of-squares, degrees of freedom, mean square, and the F ratio. Each F ratio is the ratio of the mean-square value for that source of variation to the residual mean square (with repeated-measures ANOVA, the denominator of one F ratio is the mean square for matching rather than residual mean square). If the null hypothesis is true, the F ratio is likely to be close to 1.0. If the null hypothesis is not true, the F ratio is likely to be greater than 1.0. The F ratios are not very informative by themselves, but are used to determine P values.
P values
Two-way ANOVA partitions the overall variance of the outcome variable into three components, plus a residual (or error) term. Therefore it computes P values that test three null hypotheses (repeated measures two-way ANOVA adds yet another P value).
Interaction P value
The null hypothesis is that there is no interaction between columns (data sets) and rows. More precisely, the null hypothesis states that any systematic differences between columns are the same for each row and that any systematic differences between rows are the same for each column. Often the test of interaction is the most important of the three tests. If columns represent drugs and rows represent gender, then the null hypothesis is that the differences between the drugs are consistent for men and women.
The P value answers this question:
If the null hypothesis is true, what is the chance of randomly sampling subjects and ending up with as much (or more) interaction than you have observed?
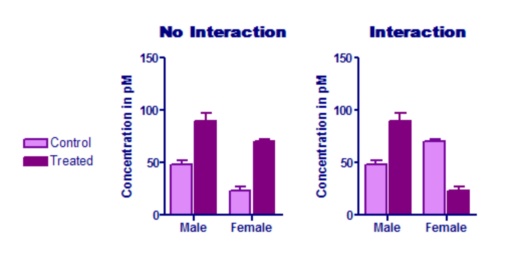
The graph on the left below shows no interaction. The treatment has about the same effect in males and females. The graph on the right, in contrast, shows a huge interaction. the effect of the treatment is completely different in males (treatment increases the concentration) and females (where the treatment decreases the concentration). In this example, the treatment effect goes in the opposite direction for males and females. But the test for interaction does not test whether the effect goes in different directions. It tests whether the average treatment effect is the same for each row (each gender, for this example).
Testing for interaction requires that you enter replicate values or mean and SD (or SEM) and N. If you entered only a single value for each row/column pair, Prism assumes that there is no interaction, and continues with the other calculations. Depending on your experimental design, this assumption may or may not make sense.
Column factor P value
The null hypothesis is that the mean of each column (totally ignoring the rows) is the same in the overall population, and that all differences we see between column means are due to chance. In the example graphed above, results for control and treated were entered in different columns (with males and females being entered in different rows). The null hypothesis is that the treatment was ineffective so control and treated values differ only due to chance. The P value answers this question: If the null hypothesis is true, what is the chance of randomly obtaining column means as different (or more so) than you have observed?
In the example shown in the left graph above, the P value for the column factor (treatment) is 0.0002. The treatment has an effect that is statistically significant.
In the example shown in the right graph above, the P value for the column factor (treatment) is very high (0.54). On average, the treatment effect is indistinguishable from random variation. But this P value is not meaningful in this example. Since the interaction P value is low, you know that the effect of the treatment is not the same at each row (each gender, for this example). In fact, for this example, the treatment has opposite effects in males and females. Accordingly, asking about the overall, average, treatment effect doesn't make any sense.
Row factor P value
The null hypothesis is that the mean of each row (totally ignoring the columns) is the same in the overall population, and that all differences we see between row means are due to chance. In the example above, the rows represent gender, so the null hypothesis is that the mean response is the same for men and women. The P value answers this question: If the null hypothesis is true, what is the chance of randomly obtaining row means as different (or more so) than you have observed?
In both examples above, the P value for the row factor (gender) is very low.
Multiple comparisons tests
Multiple comparisons testing is one of the most confusing topics in statistics. Since Prism offers nearly the same multiple comparisons tests for one-way ANOVA and two-way ANOVA, we have consolidated the information on multiple comparisons.
References
David J. Sheskin. Handbook of Parametric and Nonparametric Statistical Procedures: Third Edition IBSN:1584884401.