1. Create a survival table
From the Welcome or New Table dialog, choose the Survival tab.
If you aren't ready to enter your own data yet, choose to use sample data, and choose one of the sample data sets.
2. Enter the survival times
Enter each subject on a separate row in the table, following these guidelines:
•Enter time until censoring or death (or whatever event you are tracking) in the X column. Use any convenient unit, such as days or months. Time zero does not have to be some specified calendar date; rather it is defined to be the date that each subject entered the study so may be a different calendar date for different subjects. In some clinical studies, time zero spans several calendar years as patients are enrolled. You have to enter duration as a number, and cannot enter dates directly.
•Optionally, enter row titles to identify each subject.
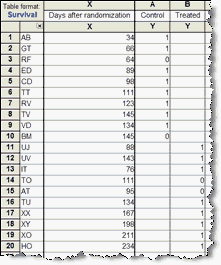
•Enter “1” into the Y column for rows where the subject died (or the event occurred) at the time shown in the X column. Enter “0” into the rows where the subject was censored at that time. Every subject in a survival study either dies or is censored.
•Enter subjects for each treatment group into a different Y column. Place the X values for the subjects for the first group at the top of the table with the Y codes in the first Y column. Place the X values for the second group of subjects beneath those for the first group (X values do not have to be sorted, and the X column may well contain the same value more than once). Place the corresponding Y codes in the second Y column, leaving the first column blank. In the example below, data for group A were entered in the first 14 rows, and data for group B started in row 15.

•If the treatment groups are intrinsically ordered (perhaps increasing dose) maintain that order when entering data. Make sure that the progression from column A to column B to column C follows the natural order of the treatment groups. If the treatment groups don't have a natural order, it doesn't matter how you arrange them.
•Double check that the number of rows with data entered in a column matches the number of people/animals/whatever i that treatment group.
Entering data for survival studies can be tricky. See answers to common questions, an example of a clinical study, and an example of an animal study.
3. View the graph and results
After you are done entering your data, go to the new graph to see the completed survival curve. Go to the automatically created results sheet to see the results of the logrank test, which compares the curves (if you entered more than one data set).
Interpreting results: Kaplan-Meier curves
Interpreting results: Comparing two survival curves
Interpreting results: Comparing three or more survival curves