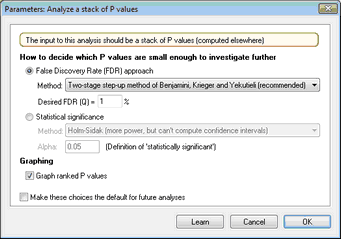
Enter a stack of P values that were computed elsewhere into a column A of a Prism Column table, and choose this new analysis to determine which of those P values are small enough for the corresponding comparison to be worth investigating further. Use the approach of statistical significance with multiple comparisons or the method of controlling the false-discovery rate.
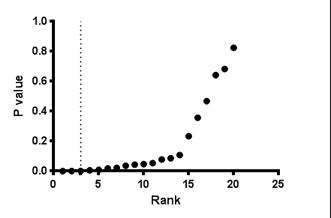
This analysis also lets you plot the rank of each P value vs. the actual P value, a common way to visualize the distribution of a set of P values.