Prism offers six distinct types of data tables. Four of these can be used to create bar graphs, as detailed below. If you want to create a bar graph, it is important to choose the kind of data table that matches your data.
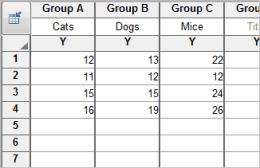
Column graphs
Enter data for each group into its own column, stacking replicates (if any). Each column then becomes a bar, and you'll be able to control the appearance of each bar individually.

Note: If you want to create a graph like the one above, but you've already calculated your mean and error values, start instead with a Grouped table (see below) and use only the top row.
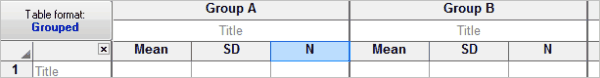
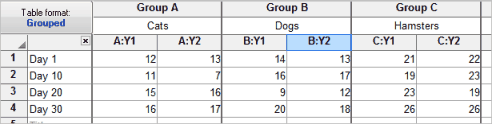
Grouped graphs
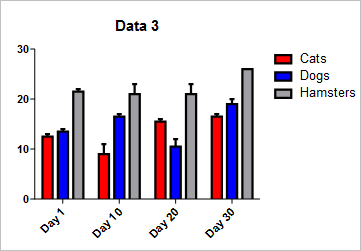
Each column represents a different kind of bar. Each row is a different instance of that bar. Enter replicates (if any) in side-by-side subcolumns. So if you have three Y columns and four rows, you will have three kinds of bars, and you can choose the color, fill, and border of each. You will have four different bars of each type. You can choose whether you want the bars interleaved, stacked, or separated on the Welcome dialog or by clicking Change and then Type of graph.
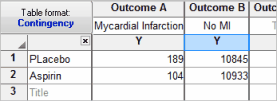
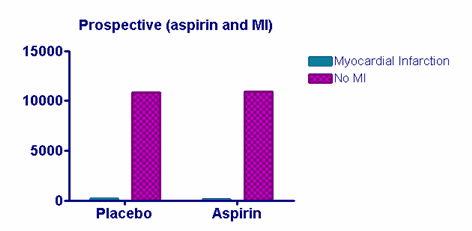
Contingency tables
A contingency table is like a grouped table but doesn't have subcolumns for replicate values.
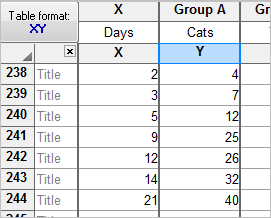
XY Bar graphs
Both the kinds of bar graphs mentioned above place the bars on the graph in order, with equal spacing. In some cases, you want to position each bar along the X axis with the position determined by an X coordinate you enter. To make this graph, choose the Spikes graph in the New Graph dialog.
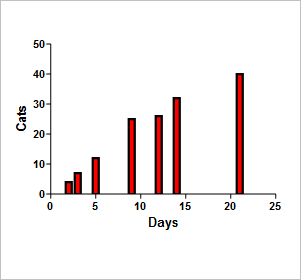
Settings in the Format Graph dialog also let you make this graph. Uncheck the option to "Show Symbols" and check the option to "Show bars/spikes."