Parts of whole and heat maps are distinct, but for XY, Survival, Column, Grouped and Contingency table graphs, the first tab of the Format Graph dialog controls the appearance of symbols, bars, lines, etc.
Change the appearance of one, several, or all data sets.
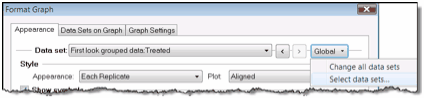
•One data set. Choose a data set from the drop down on the top of the dialog, then change the settings for that data set.
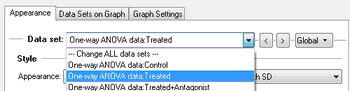
•All data sets. Drop the Global menu at the top right of the dialog, choose to change all data sets, and then make the changes. Any changes you make after choosing the change all data sets will apply to all the data sets. Changes you made before making that choice only apply to the data set selected then. Shortcut: Hold the Control key down while you make changes. Any changes made while holding Control down will apply to all data sets on the graph. When you are in global mode (change all data sets), the cursor changes to include a globe:

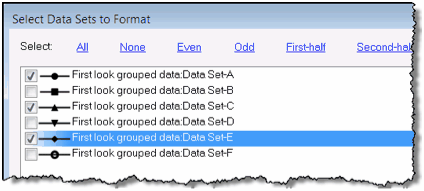
•Several data sets. Drop the Global menu at the top right of the dialog. Choose some data sets, and then change the settings for those data sets. For example, you could select data sets A, C, E, and G and change all of those data sets to use a dotted line. Then choose B, D, F and H, and make those lines solid. Any changes you make after choosing a set of data sets to change will apply to those data sets.