What is a contingency table?
Contingency tables are used to tabulate the actual number of subjects (or observations) that fall into the categories defined by the rows and columns of a table.
The rows and columns can be defined in different ways, based on experimental design.
•Prospective: You choose subjects based on exposure, from which you define the rows. Each column represents a different outcome.
•Retrospective (case-control): Each column represents a different group of subjects, identified based on presence or absence of disease. Each row represents a different exposure they have had in the past.
•Experiment: Each row represents a different treatment group. Each column represents a different outcome.
•Cross-sectional: You select a group of subjects, and then categorize them by exposure (different rows) and disease (different columns).
Analyses performed from a contingency table
•Fisher’s exact test
•Chi-square test
•Odds ratios and relative risk
Example of a contingency table
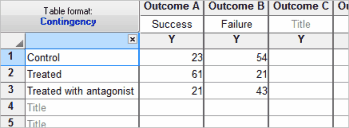
The three rows represent three different treatments. The two columns represent two alternative outcomes. Each value is the actual number of subjects (in this case; in other cases, the values may represent number of objects or events).
It is essential that you enter the actual number of subjects (objects, events...) that you counted. Do not enter normalized values or percentages. Since the values are counts, they cannot be negative and must be integers. Prism won't let you enter a minus sign or decimal point or create subcolumns. If you need to enter fractions or negative numbers, or create a table with subcolumns, use a Grouped table instead.