Formatted data tables simplify graphing
Unlike spreadsheet programs, and other scientific graphing programs, Prism's data tables are structured or formatted. Whenever you create a new data table, choose one of six table types. This makes it much easier to create appropriate graphs and to choose suitable analyses. |
|

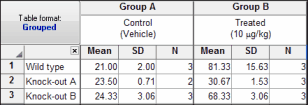
Enter SD or SEM values computed elsewhere
If you computed error values elsewhere, enter them onto labeled (SD or SEM) subcolumns. Prism’s analyses (i.e. t test, ANOVA, regression) will take into account the SD (or SEM) and sample size. |
|
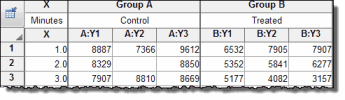
Create error bars from raw data
Enter the raw data (i.e. triplicates), and Prism will automatically compute and plot the error bars. You can instantly switch between plotting the raw data, or plotting mean with SD, SEM, confidence interval or range. |
|
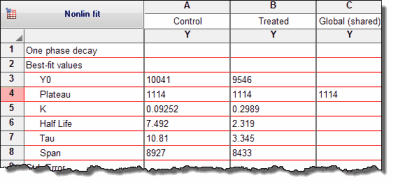
Fit a family of curves at once
Place data for multiple data sets side-by-side on an organized data table, and fit them all at once. You can fit the same model separately to each data set, use global nonlinear regression to share parameter values among data sets, or fit different models to different data sets. |
|
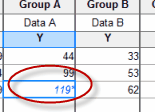
Easily handle missing and excluded values
Using a command on the View menu (or via right clicking, or a toolbar button) exclude selected values. Excluded values show on the data table in blue italics but are omitted from analyses and graphs. You can also leave a cell blank to show that its value is missing. Prism treats missing and excluded values identically, and never treats a missing or excluded value as if you entered zero. |
|
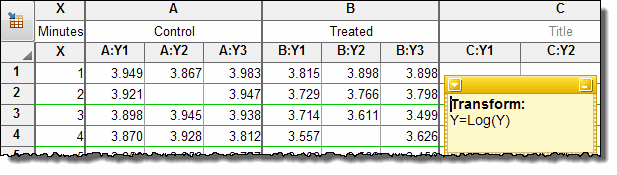
Computed values are kept separate from raw data
Prism includes built-in analyses to transform or normalize your data, or to subtract (or divide by) a baseline. Prism leaves your raw data alone, and places the calculated values on results tables. Raw data tables have a black grid. Results tables have either Green grids (when they can be analyzed further or graphed) or red grids. You’ll never confuse raw data with calculated results. You'll never wonder how values were computed. |
|