To change colors individually, without dealing with color schemes:
•Change the color of a data set in the Format Graph dialog. Double-click on the graph to open it.
•To change the color of just one data point, right-click on that point or bar and choose Format this data point
•Change the color of axes in the first tab of the Format Axes dialog. Double click on an axis to open it.
When you choose any color in Prism mac, you use the standard OSX color picker.
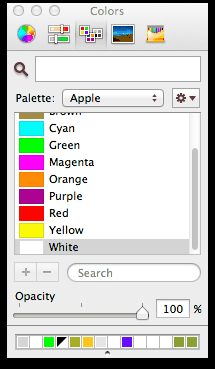
•The toolbar at the top lets you choose one of five different approaches to choosing a color. The example above shows choosing from a list of colors, but the buttons above let you also use a color wheel, color sliders (to enter RGB or CMYK), crayons, or choosing from a color palette.
•The magnifying glass icon gives you a sixth way to choose colors, by matching a color elsewhere on your screen. Click on the icon, then click on any color showing on your screen (ok if it is a different application).
•The custom colors at the very bottom of the dialog offer a seventh way to choose a color. Simply click on the desired color. See below for adding colors to this palette.
•Once you choose a color in the color picker, you'll also see it in the Prism dialog. You don't need to click OK or close the Color Picker dialog.
•To add new colors to the custom color palette at the bottom of the dialog, drag a color down from the large swatch on top of the dialog (white in the example) and drop onto one of the custom color boxes. To choose a custom color, click on it.
•To make a color semitransparent (opaque), use the slider at the bottom of the color picker.