How do you change the grouping and spacing of bars on Grouped graphs?
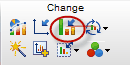
Click on the Format graph button on the Prism toolbar or double-click on any data point to open the Format Graph dialog.
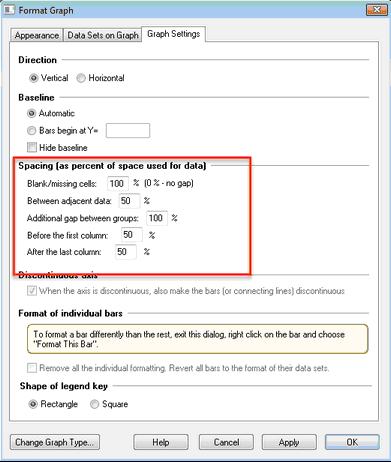
Set the standard spacing between bars
To change the standard spacing between individual bars and groups of bars, go to the Graph Settings tab.
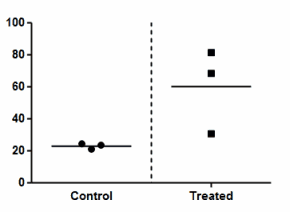
Set how you want the bars to be grouped
You can change the overall grouping scheme of a graph or make hybrid graphs types using the order tab of the Format Graph dialog. For each data set, choose whether it should be interleaved with, stacked on top of, placed apart from the (starting a new group of bars, hence the name “grouped”) or superimposed on the preceding data set.
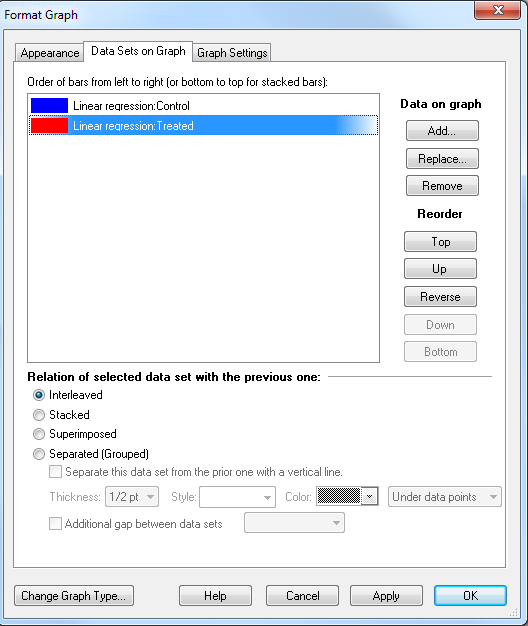
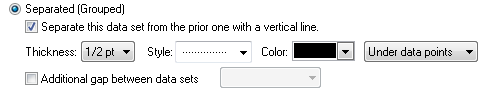
Add lines between groups
Check the box to Separate a data set from another with a line.
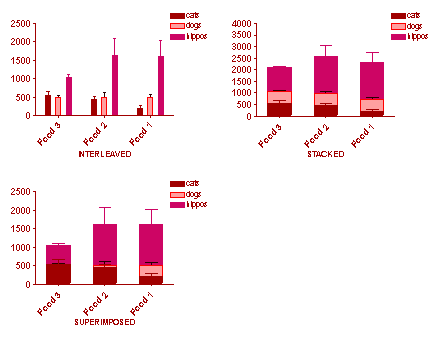
Stacked and superimposed bars
Note the difference between Stacked and Superimposed below. When the bars are superimposed, each extends from the X axis to the value. When bars are stacked, each bar starts at the top of the one below.
Notes:
•If bars are stacked, it can help to use semitransparent colors. That way you can see the smaller bar that is hidden behind a taller one.
•Use the middle tab of Format Graph to change the order of data sets, which controls which data set is on top.
•With stacked bars, each row in the data table becomes one stack of bars. If you want to leave a gap between stacks (to create a natural grouping of sets of stacked bars), leave a blank row in your data table.
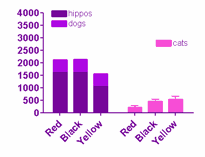
•It sometimes is helpful to combine both stacked and interleaved bars on the same graph as below. This is done by checking the option to stack the "dogs" data set on top of hippos, and to make the "cats" data set grouped.