This equation is used when X values are concentrations or doses. Use a related equation when X values are logarithms of concentrations or doses.
Introduction
Many dose-response curves follow a familiar sigmoidal shape. These curves are often defined by four parameters: Top, Bottom, Hill slope, and the EC50 (or IC50). The Top and Bottom parameters describe the values at which the curve reach a plateau - coming infinitely close, but never quite reaching these values. The Hill slope describes the slope of the sigmoidal curve between these two plateaus. The EC50 (or IC50) refer to a concentration of agonist (or antagonist) required to increase (or reduce) the measured response to half - or 50% - of its maximal value.
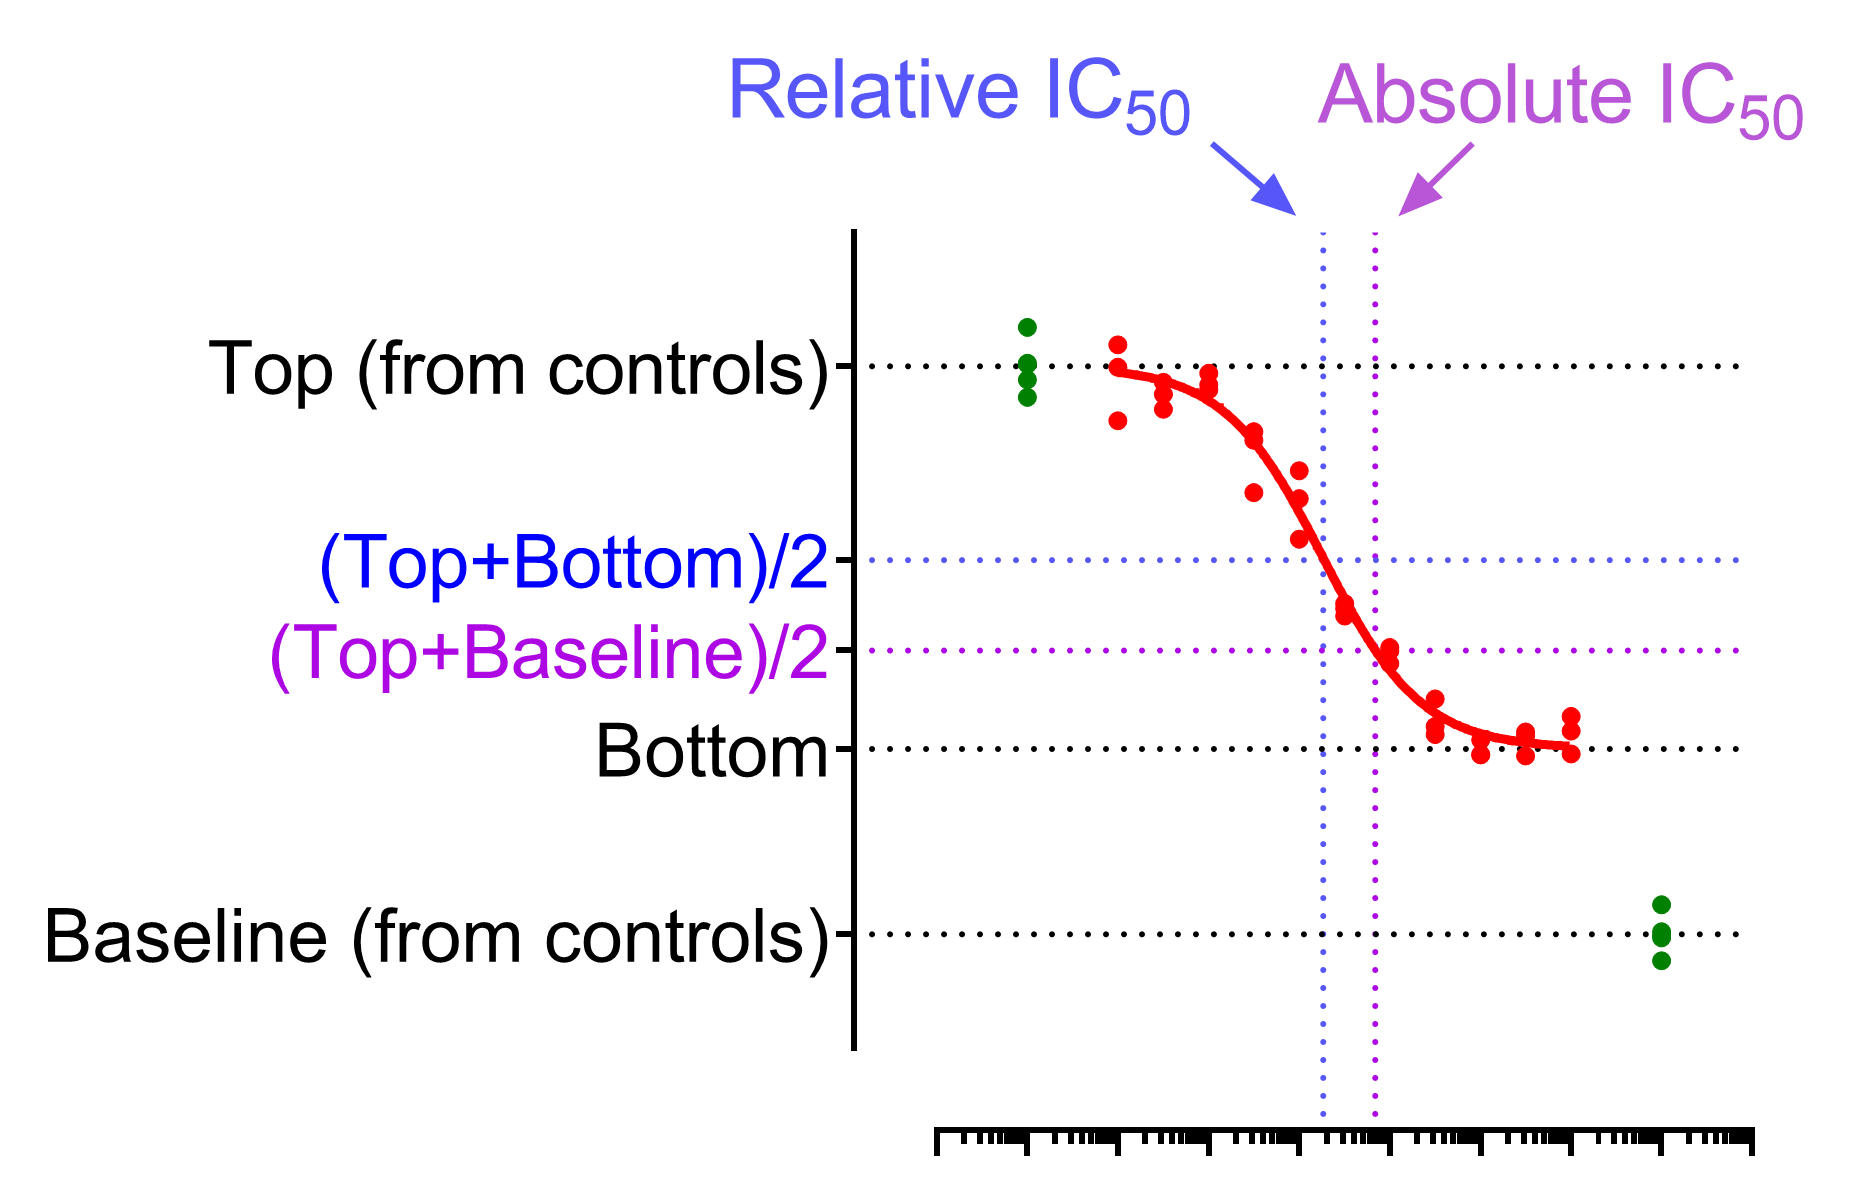
However, there are a number of ways that this concept of "half" can be interpreted. Are you interested in the concentration that results in a measured response halfway between the maximal (Top) and minimal (Bottom) values of the curve? Or do you want the concentration that results in a measured response halfway between the maximal (Top) value of the curve and some defined "baseline" control value?
When considering inhibitory data (measured response decreases with increasing concentration of antagonist), these two values are referred to as the Relative IC50 and Absolute IC50, respectively.
Relative IC50
This is by far the most common definition, and is usually what people mean by "the IC50" of a response. It is the concentration required to bring the curve down to a point halfway between the "Top" and "Bottom" plateaus of the curve. Unless the data are normalized to run from 0 to 100, this is not the value that corresponds to 50% on the Y axis.
Absolute IC50
The concentration that provokes a response halfway between the blank (no antagonist, maximum measured response) and some positive control (to represent a fully inhibited response) is sometimes called the Absolute IC50. In many cases, the positive control used may be a different, standard drug known to elicit a maximal inhibitory effect on the measured response. Often, the response measured for this standard positive control is lower than the "Bottom" of the dose-response curve. As a result, the Absolute IC50 and Relative IC50 will not be the same.
In some cases, an Absolute IC50 simply cannot be calculated. For example, the antagonist being tested may only capable of reducing a measured response to 60% of its maximal (blank) value, but no further. In this case, the Absolute IC50 would not be defined (no increase in the concentration of antagonist would be capable of lowering the measured response to 50% of the maximal response). Be sure to know which IC50 you want to report, and what your values mean.
Read more about Absolute IC50 here.
Step by step
Create an XY data table. Enter the concentration of the agonist into X. Enter response into Y in any convenient units.
From the data table, click Analyze, choose nonlinear regression, and choose the panel of equations: Dose-Response -- Special, X is concentration. Then choose "Absolute IC50, X is concentration".
You must enter a value for the parameter "Baseline" on the Constrain tab of the analysis parameters dialog. Note the important distinction between "Baseline" and "Bottom" in this model. "Bottom" is the Y value of the bottom plateau of the curve itself. "Baseline" is the Y value that defines 0% - maximal inhibition by a standard drug. While you must constrain the baseline, you may want to consider constraining the "Top" parameter as well.
Model
Fifty=(Top+Baseline)/2
Y= Bottom + (Top-Bottom)/(1+((Top-Bottom)/(Fifty-Bottom)-1)*(AbsoluteIC50/X)^HillSlope)
Interpret the parameters
Top and Bottom are plateaus in the units of the Y axis.
HillSlope describes the steepness of the family of curves. A HillSlope of 1.0 is standard, and you should consider constraining the Hill Slope to a constant value of 1.0. A Hill slope greater than 1.0 is steeper, and a Hill slope less than 1.0 is shallower.
Baseline is the measured response of a "standard" drug or control resulting in a maximally inhibited response. This value must be entered by the user in the constrain tab of the analysis parameters dialog.
AbsoluteIC50 is the concentration of antagonist that gives a response half way between Top and Baseline. This is not the same as the response half way between Top and Bottom (this is the relative IC50, and is not reported by this analysis). Prism also reports the LogAbsoluteIC50.