Prism does not automatically write equations on the graph. There are two approaches you can use to do so.
Microsoft Office comes with an equation editor. If Microsoft Equation Editor is installed on your system, you will see a quick-access button on your toolbar when you are on either a graph or a layout sheet.

You can create either a generic equation, or an equation with the best-fit values of the parameters substituted for the variable names.
If the button doesn't appear on your toolbar, create the equation inside of Microsoft Word or some other program, and then copy and paste.
Another approach is to simply show the parameter values from the curve of best fit in tabular form. Copy selected results and then paste onto a graph. The table will be linked, so its values will change if you edit or replace the data. This doesn't show the form of the equation (exponential decay, in this example) but gives you the results of this particular experiment, which may be more important.
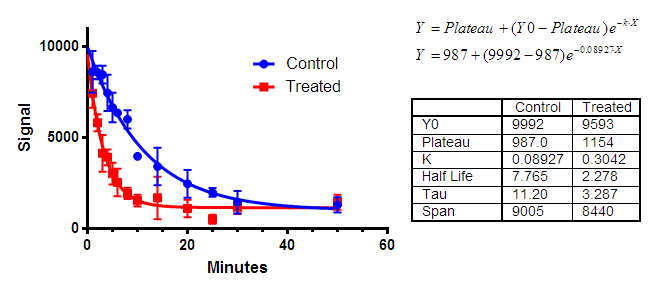
The example below shows use of the equation editor to write both a generic and specific equation (for the control data set) and an embedded table showing the results for both data sets.