Introduction
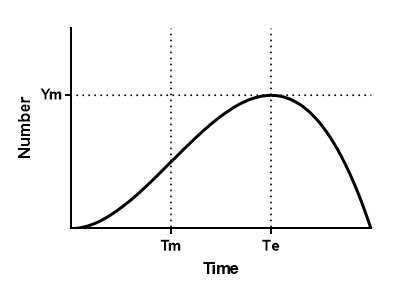
This is one (of many) models that shows a population peaking and then declining. You might find it a useful starting point. But note that the population starts and ends at Y=0, so you may want to add a constant...
Step by step
Create an XY table. Enter time values into X and population values into Y. After entering data, click Analyze, choose nonlinear regression, choose the panel of growth equations, and choose Beta growth and decline.
Model
Y=Ym*(1+ (Te - X)/(Te - Tm))*(X/Te)^(Te/(Te-Tm))
Interpret the parameters
Ym is the population at peak (same units as Y)
Te is the time at which population peaks (same units as X)
Tm is the time of infection point (same units as X)