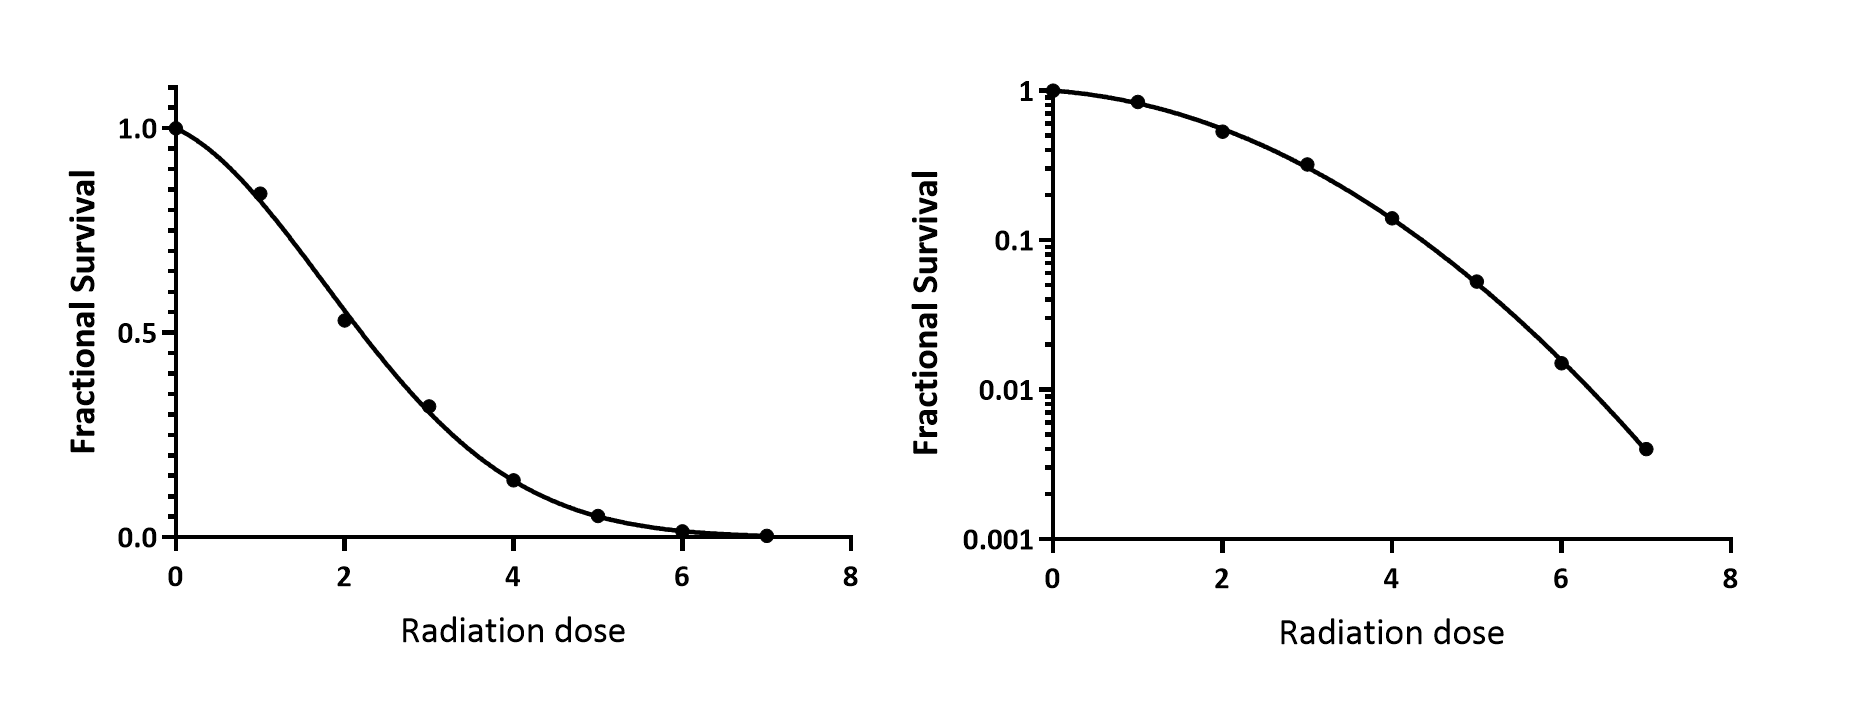
The graph on the left below uses a linear Y axis. The graph on the right uses a logarithmic Y axis. This was done in GraphPad Prism by making the change in the Format Axis dialog. The nonlinear regression "saw" the original data where the Y values were fractions (not logarithm of fractions; that would require a modified model).
Prism does not include variations of the model where the Y values are the logarithms of fractions or percentages of cells dead or alive, but it wouldn't be hard to clone the built-in equations and modify them.