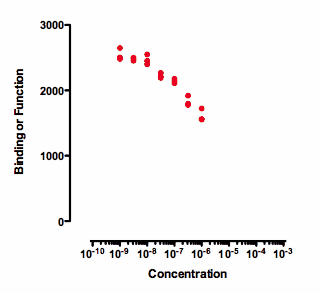
Any attempt to determine an IC50 by fitting a curve to the data in the graph above will be useless. Prism might, or might not, be able to fit a dose-response curve to the data. But if the curve fits, the value of the IC50 is likely to be meaningless and have a very wide confidence interval. The data simply don't really define a top plateau (which would define 100) and certainly doesn't provide even a hint of a bottom plateau (which would define 0). If data haven't defined 100 or 0, then 50 is undefined too, as is the IC50.
If you also have control values that define 100 and 0, then the curve can be easily fit. The curve below was created by fitting a dose response curve, but constraining the Top plateau to be a constant value equal to the mean of the Blanks values, and the Bottom plateau equal to the mean of the NS values. Note that the blank and NS values are shown in green.
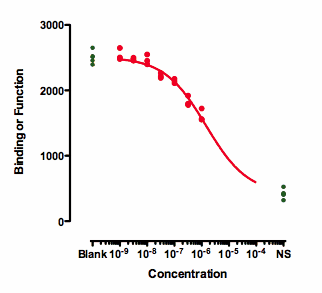
The value of the IC50 fit this way only makes sense if you assume that higher concentrations of the inhibitor would eventually inhibit down to the NS values. That is an assumption that can't be tested with the data at hand.
An alternative approach would be to enter the blank values with a small X value as if it is response provoked by a super tiny concentration, and enter the nonspecific data with a large X value. Then fit all four parameters without constraint. This prevents the blank and NS data from having too much weight. Weimer and colleagues suggest this is a better way to analyze the data than using the Blank and NS data to constrain the curve (1).
The distinction between relative and absolute IC50 doesn't really apply to these data. Because the data don't define a bottom plateau, the IC50 can only be defined relative to the NS control values.
Reference
1.Weimer, M., Jiang, X., Ponta, O., Stanzel, S., Freyberger, A., and Kopp-Schneider, A. (2012). The impact of data transformations on concentration–response modeling. Toxicology Letters 213: 292–298.