Introduction
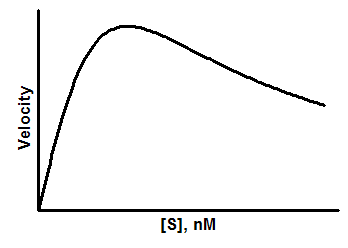
At high concentrations, some substrates also inhibit the enzyme activity. Substrate inhibition occurs with about 20% of all known enzymes. It happens when two molecules of substrate can bind to the enzyme, and thus block activity.
Step by step
Create an XY data table. Enter substrate concentration into the X column, and enzyme activity into the Y columns. If you have several experimental conditions, place the first into column A, the second into column B, etc.
After entering data, click Analyze, choose nonlinear regression, choose the panel of enzyme kinetics equations, and choose Substrate inhibition.
Model
Y=Vmax*X/(Km + X*(1+X/Ki))
Parameters
Vmax is the maximum enzyme velocity, if the substrate didn't also inhibit enzyme activity, expressed in the same units as Y.
Km is the Michaelis-Menten constant, expressed in the same units as X. It describes the interaction of substrate and enzyme in the absence of inhibitor.
Ki is the dissociation constant for substrate binding in such a way that two substrates can bind to an enzyme. It is expressed in the same units as X.
Note: Prism 7 and later use a different (improved) set of rules for initial values than did Prism 6.
Why this model doesn't always converge on a fit
It is easier to understand the problems of fitting this model if it is rearranged:
Y=Vmax/(Km/X + 1 + X/Ki)
Vmax controls the height of the peak (but doesn't equal the Y value at the peak).
When X values are small, the last term approaches zero, so the early parts of the curve (small X values) are determined by the value of Km.
Conversely, when X values are large, the first term approaches zero, so the later parts of the curve (higher X values) are determined by the value of Ki.
The middle part of the curve is determined by both Ki and Km.
There are two reasons why the fit would result in an "ambiguous" result.
•There are not data points at a wide enough range of X values. There need to be X values less than Km and greater than Ki, ideally lots of X values. If you only have data in the middle of the curve, there simply is no information to separately determine Km and Ki.
•The shape of the curve, while it looks like a substrate inhibition curve, simply isn't quite right. In other words, the data really don't comply with the substrate inhibition model.