The problem: Repeated measures ANOVA cannot handle missing values
Repeated measures ANOVA calculations require complete data. If a value is missing for one partiicpant or animal, you'd need to ignore all data for that participant or animal. The only way to overcome this (using ANOVA) would be to impute what the values of the missing values probably were and then analyze without any missing values, correcting the results (reducing df) to account for the imputing. This is not a preferred method, and is not offered by Prism.
Prism offers fitting a mixed effects model to analyze repeated measures data with missing values.
Fitting a mixed effects model - the big picture
The mixed effects model approach is very general and can be used (in general, not in Prism) to analyze a wide variety of experimental designs. Many books have been written on the mixed effects model. Because of this versatility, the mixed effects model approach (in general) is not for beginners.
Prism 8 fits the mixed effects model for repeated measures data. Prism uses a mixed effects model approach that gives the same results as repeated measures ANOVA if there are no missing values, and comparable results when there are missing values.
Prism uses the mixed effects model in only this one context. You don't have to, or get to, define a covariance matrix. You can't add a covariate. You can't compare alternative mixed effects models. You can't do mixed effects model regression.
When fitting a mixed effects model in Prism, think of it as repeated measures ANOVA that allows missing values.
Mixed? Fixed vs. random factors
Statistical calculations can deal with two kinds of factors.
•A factor is fixed when you wish to test for variation among the means of the particular groups from which you have collected data.
•A factor is random when you have randomly selected groups from an infinite (or at least large) number of possible groups, and that you want to reach conclusions about differences among all the groups, not just the groups from which you collected data.
ANOVA works by partitioning the total variation among values into different components. With repeated measures ANOVA, one of those components is variation among participants or blocks. In Prism, ANOVA treats all factors, including participant or block, as fixed factors.
As the name suggests, the mixed effects model approach fits a model to the data. The model is mixed because there are both fixed and random factors. When Prism does mixed-model analysis of repeated measures data, it assumes that the main factors (defined by the data set columns in one-way, and by data set columns and rows in two- and three-way) are fixed, but that subjects (or participants, or runs..) are random. You are not interested in variation among those particular participants, but want to know about variation among participants in general.
Results of the two methods
The results of repeated measures ANOVA and fitting a mixed effects model look quite different. Here are examples of the one-way repeated measures data (with no missing values) analyzed both ways.
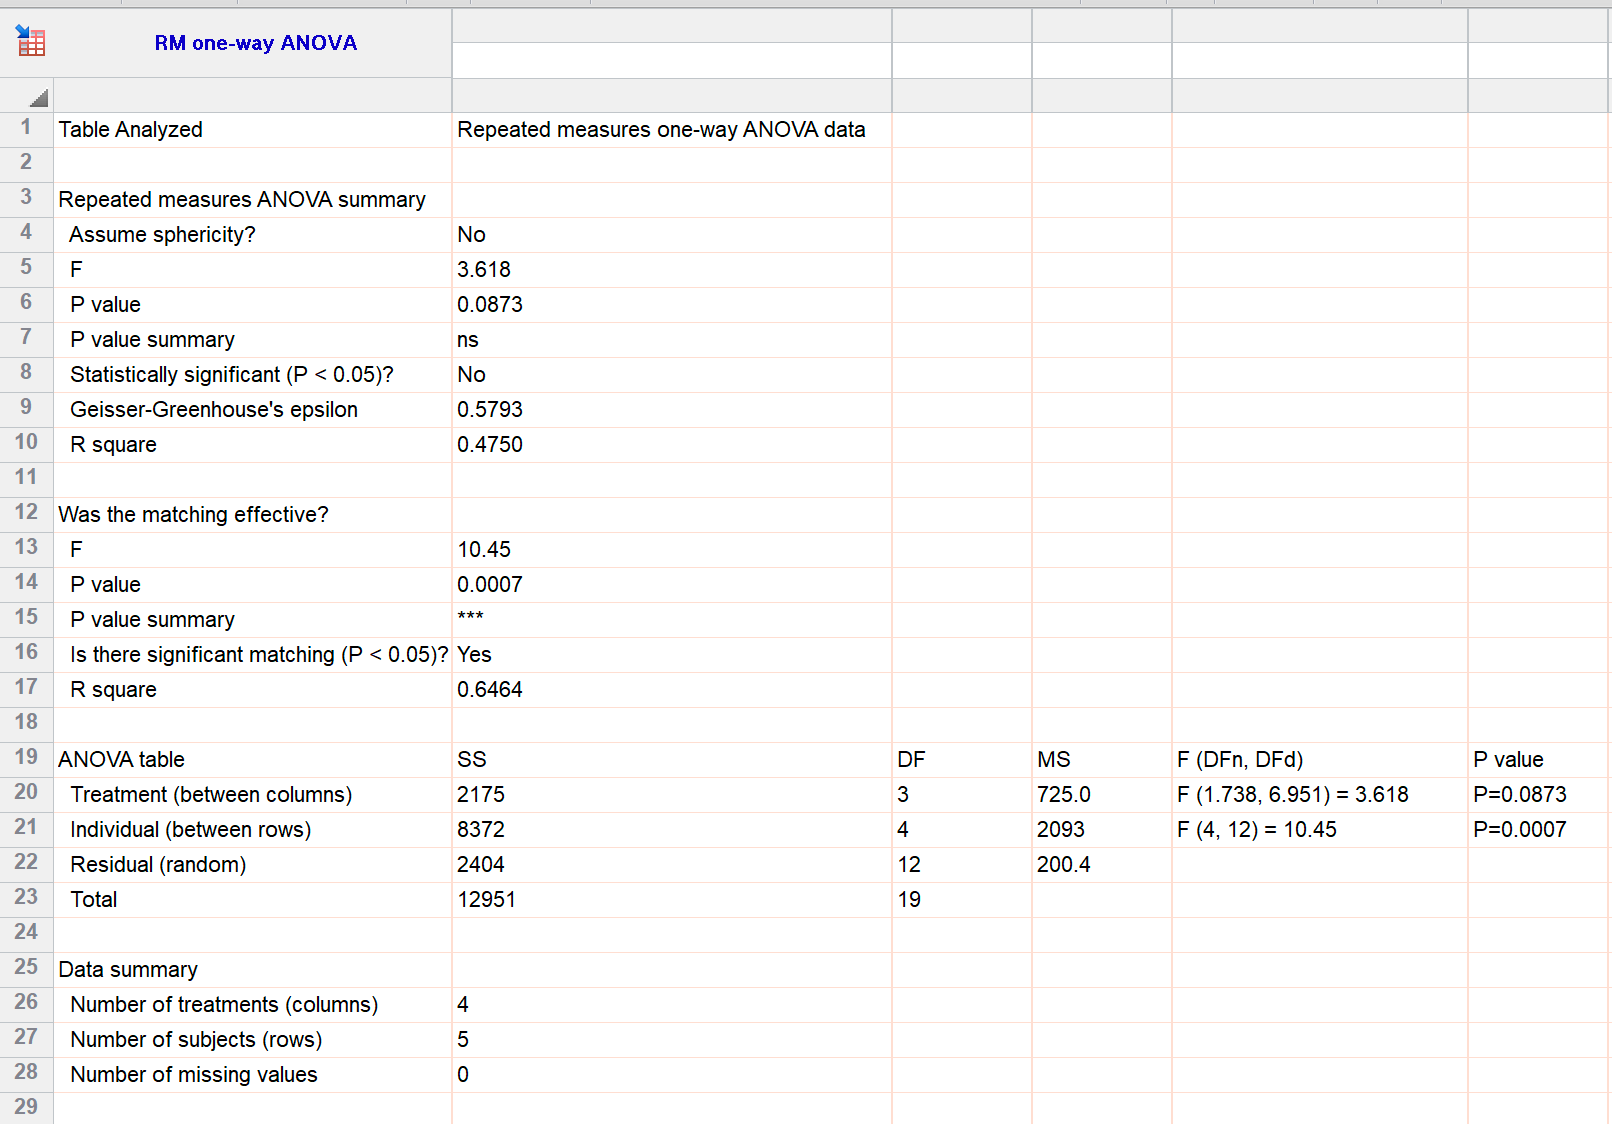
Repeated measures ANOVA results
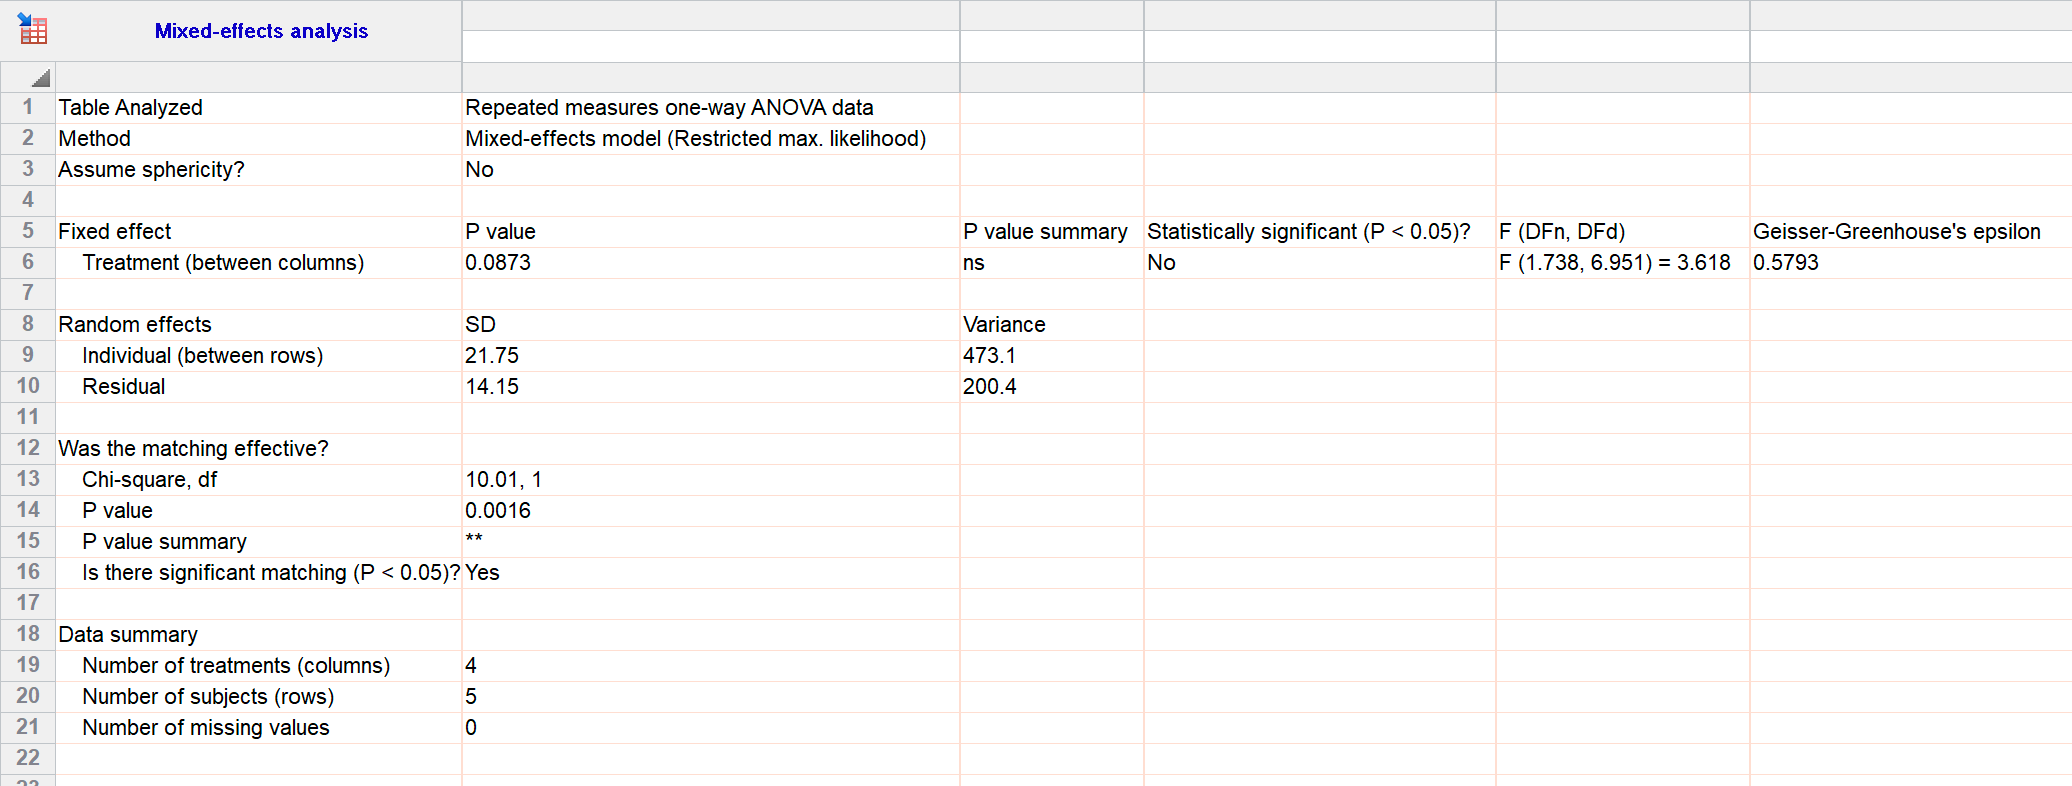
Mixed effects model results
Main results are the same
The main result is the P value that tests the null hypothesis that all the treatment groups have identical population means. That P value is 0.0873 by both methods (row 6 and repeated in row 20 for ANOVA; row 6 for mixed effects model). For these data, the differences between treatments are not statistically significant.
Multiple comparisons results are the same
Multiple comparisons following repeated measures ANOVA are computed from the pooled standard deviation, which is the square root of the mean square residuals.
Multiple comparisons following fitting a mixed effects model is much more complicated, based on matrix algebra. With no missing data, the two are equivalent.
Some results differ
One part of the results differ, the part that tests whether there was indeed variation among subjects. ANOVA tests this by having variation among subjects one of the variation components, and tests for its contribution with a F ratio and P value, which is 0.0007 (line 21 above). The mixed effects model compares the fit of a model where subjects are a random factor vs. a model that ignores difference between subjects. This results in a chi-square ratio and P value, which is 0.0016 (line 14 above). Because ANOVA assumes subjects are a fixed factor (you care about those specific subjects) and the mixed effects model treats subjects as a random factor (you care about subjects in general), the two P values are usually not the same.