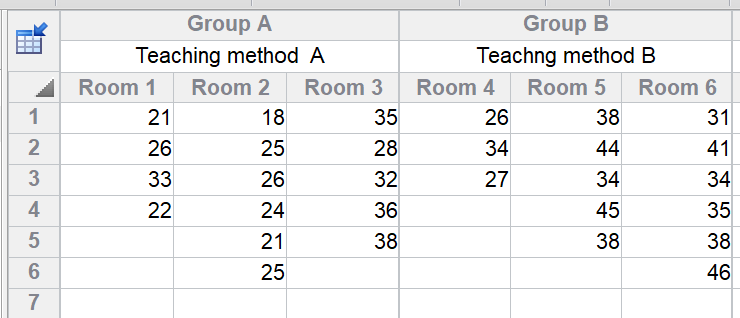
1. Data entry
This is the tutorial data provided with Prism for the nested t test. You are comparing two teaching methods (data set columns), each used in three rooms (subcolumns), with an outcome measured in between 4-6 students per rooms (rows).
If you are not using the tutorial data, create a Nested table, and set it up the number of subcolumns corresponding to the number of actual replicates you have. In the example, there are three rooms used for each teaching method, so create the table with three subcolumns.
Enter the data with the technical replicates stacked. In the example, you tested between 4 and 6 students in each room and these are stacked in each subcolumn. In a lab example, you might apply each alternative treatment to three rats (subcolumns) and measure something in each rat a number of times (technical replicates, stacked in the subcolumn)
If you want to label the subcolumns appropriately ("Room1"... below), double click on a subcolumn header to bring up the dialog where you enter all the subcolumn titles.
Notes:
•The term "technical replicates" may not always apply. If you are studying three hospitals in each group, with four doctors in each hospital, stack the information for each hospital in a subcolumn, with each doctor on a different row.
•Note that the replicates are stacked. This is different than Prism usually works. We set it up this way for two reasons. First, it lets you label the subcolumns ("Room 1", "Room 2"...above). Second, it matches the way most texts do this analysis. If you entered data with technical replicates (students in this example) side by side with different replicates (rooms in this example) in different rows, Prism's nested t test analysis would give meaningless results.
•The order of values in each subcolumn is arbitrary. You could randomly scramble the data in each subcolumn and the results won't change. The values in row 2 are not at all matched to each other.
•The order of the subcolumns doesn't matter. If you swapped the data for Room 2 and Room 3, the result would be the same. There is no connection between, say, the second subcolumn for the control data and the second column for the treated data.
•In this example, note that the subcolumns do not have the same number of values. The nested t tests works fine with unequal sample sizes.
•We use the name "nested t test" because it best describes the use of this test. Most books call this nested two-way ANOVA, because one factor (room in this example) is nested within another factor (teaching method).
•This example comes from Table 18.4 of Maxwell and Delaney (3rd edition). They label the second set of three classrooms 1, 2 and 3 rather than 4, 5 and 6. This is because of a quirk in how these data are analyzed in SPSS. There is no matching. The second classroom for the first teaching method (classroom 2) is not at all matched to the second classroom for the second teaching method (which we call classroom 5, but the text also calls classroom 2).
•Prism cannot run the nested t test with huge data sets and presents an message telling you so. How huge is huge? Details here.
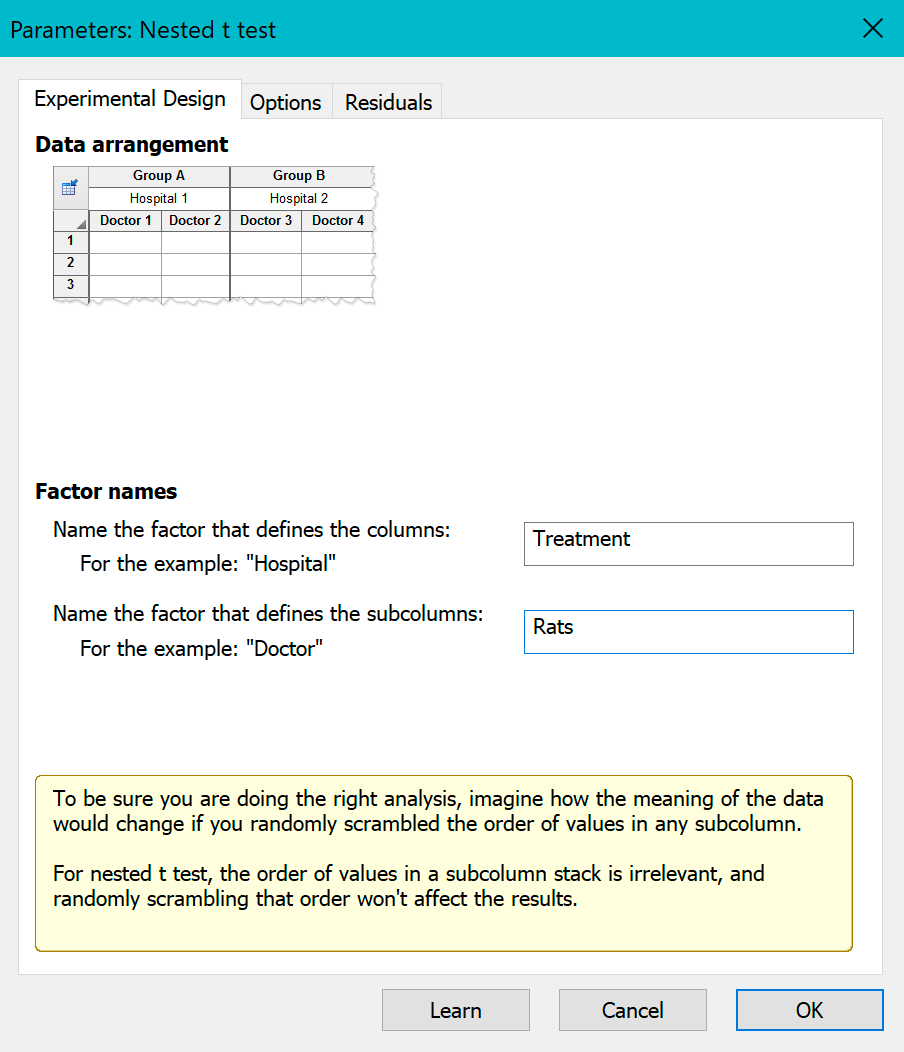
2. Run the analysis
Click Analyze and then choose nested t test from the list of Grouped analyses.
On the first tab, enter the names of the two factors:
The second tab offers options:

The third tab gives several choices for plotting residuals.