1. Enter data
Choose a Column table, and a column scatter graph. If you are not ready to enter your own data, choose the sample data set: Frequency distribution data and histogram.
2. Choose the analysis
Click Analyze and then choose Frequency distribution from the list of analyses for Column data.
3. Choose analysis options
Cumulative?
In a frequency distribution, each bin contains the number of values that lie within the range of values that define the bin. In a cumulative distribution, each bin contains the number of values that fall within or below that bin. By definition, the last bin contains the total number of values. The graph below shows a frequency distribution on the left, and a cumulative distribution of the same data on the right, both plotting the number of values in each bin.
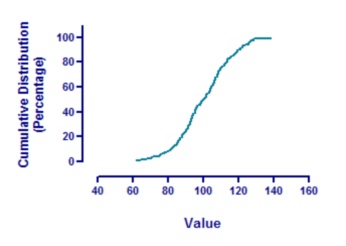
The main advantage of cumulative distributions is that you don't need to decide on a bin width. Instead, you can tabulate the exact cumulative distribution as shown below. The data set had 250 values, so this exact cumulative distribution has 250 points, making it a bit ragged. When you choose to tabulate a cumulative frequency distributions as percentages rather than fractions, those percentages are really percentiles and the resulting graph is sometimes called a percentile plot.
Relative or absolute frequencies?
Select Relative frequencies to determine the fraction (or percent) of values in each bin, rather than the actual number of values in each bin. For example, if 15 of 45 values fall into a bin, the relative frequency is 0.33 or 33%.
If you choose both cumulative and relative frequencies, you can plot the distribution using a probabilities axis. When graphed this way, a Gaussian distribution is linear.
Bin width
If you chose a cumulative frequency distributions, we suggest that you choose to create an exact distribution. In this case, you don't choose a bin width as each value is plotted individually.
To create an ordinary frequency distribution, you must decide on a bin width. If the bin width is too large, there will only be a few bins, so you will not get a good sense of how the values distribute. If the bin width is too low, many bins might have only a few values (or none) and so the number of values in adjacent bins can randomly fluctuate so much that you will not get a sense of how the data are distributed.
How many bins do you need? Partly it depends on your goals. And partly it depends on sample size. If you have a large sample, you can have more bins and still have a smooth frequency distribution. One rule of thumb is aim for a number of bins equal to the log base 2 of sample size. Prism uses this as one of its two goals when it generates an automatic bin width (the other goal is to make the bin width be a round number).
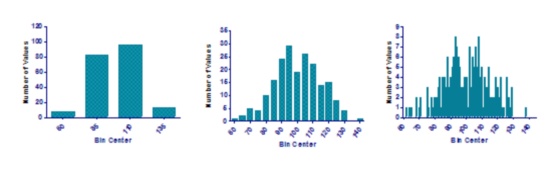
The figures below show the same data with three different bin widths. The graph in the middle displays the distribution of the data. The one on the left has too little detail, while the one on the right has too much detail.
Bin range
In addition to deciding on the bin width, which controls the number of bins, you can also choose the center of the first bin. This can be important. Imagine that your data are percentages, running from 0 to 100. There is no possibility of a value that is less than 0 (negative) or greater than 100. Let's say you want the bin width to be 10, to make 10 bins. If the first bin is centered at 0, it will contain values between -5 and 5, the next bin will contain values between 5 and 15, the next between 15 and 25, etc. Since negative values are impossible, the first bin actually includes values only between 0 and 5, so its effective bin width is half the other bin widths. Also note, there are eleven bins that contain data, not ten.
If you instead make the first bin centered at 5, it will contain values between 0 and 10, the next bin contains values from 10 to 20, etc. Now, all bins truly contain the same range of values, and all the data are contained within ten bins.
A point on the border goes with the bin holding the larger values. So if one bin goes from 3.5 to 4.5 and the next from 4.5 to 5.5, a value of 4.5 ends up in that second bin (from 4.5 to 5.5).
Replicates
If you entered replicate values, Prism can either place each replicate into its appropriate bin, or average the replicates and only place the mean into a bin.
All values too small to fit in the first bin are omitted from the analysis. You can also enter an upper limit to omit larger values from the analysis.
How to graph
See these examples.
|
Prism can only make frequency distributions from numerical data. It can handle categorical data, but only if the categories are entered as values. |
