A Parts of whole table is used when it makes sense to ask: What fraction of the total is each value? This table is often used to make a pie chart.
Analyses performed on parts of whole data
•Fraction of total
•Chi-square goodness of fit (compare observed distribution with theoretical distribution)
Example of a Parts of whole table
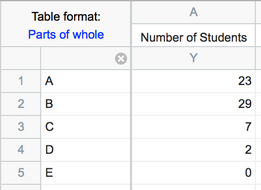
The example below shows the number of students who received grades of A, B, C, etc. The sum of the five values in the table (61) is the total number of students.
You can enter data onto as many columns as you want. But note that only the values entered into column A will be automatically graphed. Use New...Graph to plot other columns.