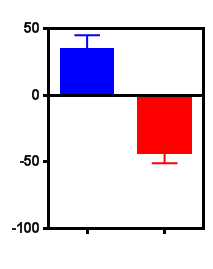
If you make a Column or Grouped bar graph with some bars having positive values and others having negative values, Prism will by default make a graph like this:
Distinguish the X axis from the bar baseline.
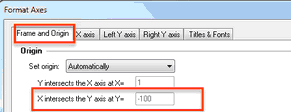
•The X axis in the graph above is at the bottom of the graph. Set the location of the X axis (and move it to Y=0) if you want in the first tab of the Format Axis dialog. Bring up this dialog by double clicking on any axis.
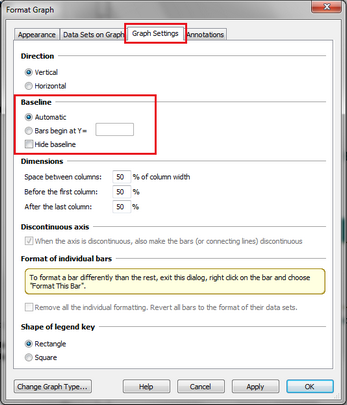
•The bar baseline is set in the third tab of the Format Graph dialog. In the graph above, the setting is at its default value of "automatic" which means Prism draws the baseline at Y=0. Bring up this dialog by double clicking on the main part of the graph.
The default graph, as above, is usually what you'll want. But if you want something different, knowing how the X axis and the bar baselines are set will let you make the kind of graph you want.