Heat maps
•Rainbow heat maps now use red for the highest value and blue for the lowest. A new "Reverse rainbow" uses the opposite convention to match Prism 7.
•Specify axis and graph titles on heat maps.
•On heat maps, when you choose to not label every row or column, but rather label every second (or third...) row or column. Prism now lets you choose which row or column to start from.
•You can make heat maps even with many thousand rows of data (Prism will average rows, when necessary).
More choices in preferences
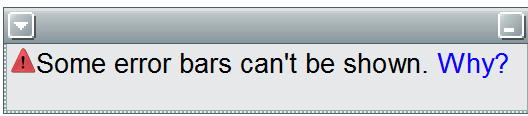
•Turn off warning messages on graphs (about error bars, etc.). But those warnings are much shorter in Prism8, so you'll probably want to leave them on.
• Set the default tick length.
•Choose an ordinary minus sign or a longer en-dash to show negative numbers on axis numbering.
•Choose how long a column or row title should be before Prism switches to labeling with "Row 4" or "Column D".
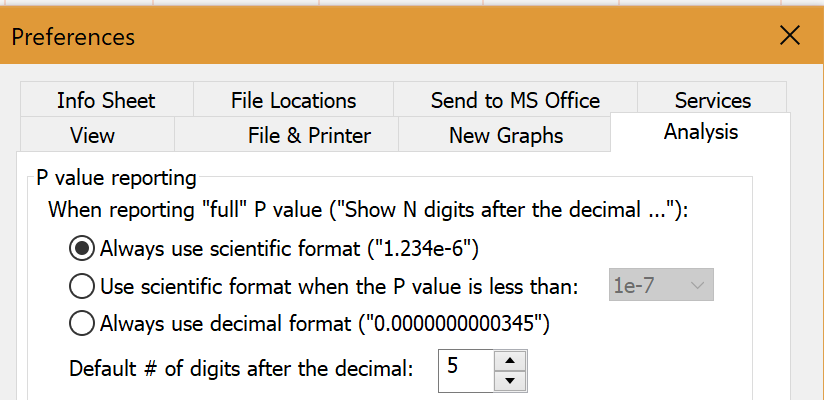
•When to use scientific format to report P values -- always, never, or it depends.