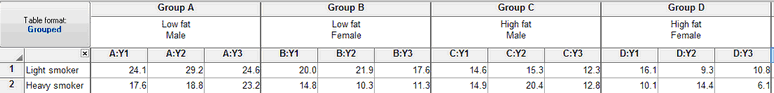
A three way graphs is a Grouped graph set up to show data entered into Prism for analysis by three-way ANOVA. The entered data look like this. Note the two line column titles. These are essential both to properly label the data, but also to properly label the graph.
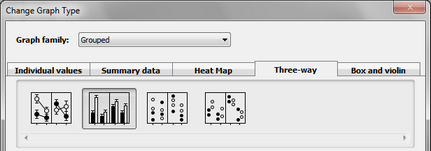
From the Change Graph Type dialog, choose the Three-way tab and one of the thumbnails.
The graph looks like this.
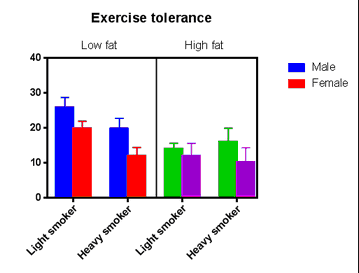
Note that the first line of the column titles in the data table become labels for the two halves of the graph, and the second line of the column title becomes the graph legend. The row titles become labels under the bars.