If you've already entered data onto an empty data table, it is too late to clone, too late to duplicate a family, and too late to open a template -- at least without copy and pasting data.
Prism provides a great tool to solve this problem: the Wand (Wizard to ANalyze Data). Use it to analyze (and graph) the new table just like you already analyzed (and graphed) an existing table.
Follow these steps:
1.Start from the data table (with data) you wish to analyze (and graph). Or select multiple data tables in the gallery.
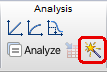
2.Click the magic wand button on the toolbar, to bring up the Analyze Data dialog.
3.Choose the existing data table (in the current project) you want to use as an example.
4.At the bottom of the dialog, optionally enter the prefix you wish to appear in front of the new sheet names.
That's it. The new table (where you started from) will be graphed and analyzed the same as the example table.
Notes:
•The name Wand was new to Prism 6. This feature used to be called Applying a Method.
•You can also choose to use the Wand to apply a stored method file. To save a method file, go to the data table that has been analyzed and graphed, drop the File menu and select Save Special… Save Method. Where is it saved? To apply that saved method file, click the Analyze button, and then choose Use Saved Method at the top left of the Analyze Data dialog.
•The same icon is used for both the Magic and Wand features. Magic (Make Graphs Consistent) changes the appearance of selected graphs so they look like an example graph. You can only use Magic when you start from a graph, or a set of graphs selected in the gallery. The Wand analyzes and graphs a new table the way you have already analyzed and graphed another table. You can only use the Wand when you start from a data table with data, or a set of selected tables.