Results tables that can be analyzed further have green grids (in contrast, tables with red grids cannot be analyzed further). There is no limit to how many analyses can be chained together in this way. When you edit or update the data table, Prism will update the entire analysis chain automatically.
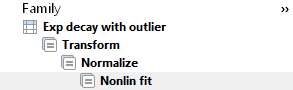
In Family pane below the Navigator, analysis chains appear as a series of indented sheet names. In this example, data are first transformed, then normalized, and then fit with nonlinear regression.