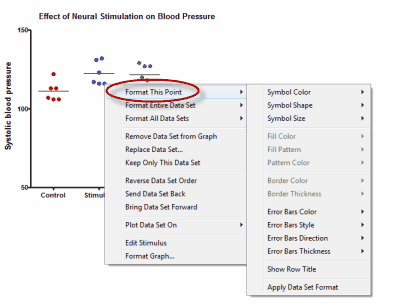
Change the look of a single point or column
Right-mouse click on the point and choose Format this Point. You can change the symbol shape, size, color and the format, color and direction of the error bars.
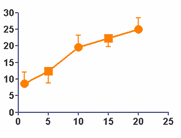
For example, on the graph below, each data point is formatted to show different symbols and error bars directions for alternating data points.
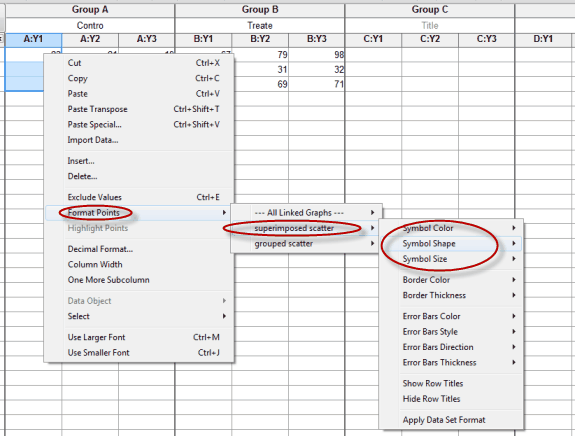
Format a range of data from the data table
Select a block of data, right click, and choose Format Points.
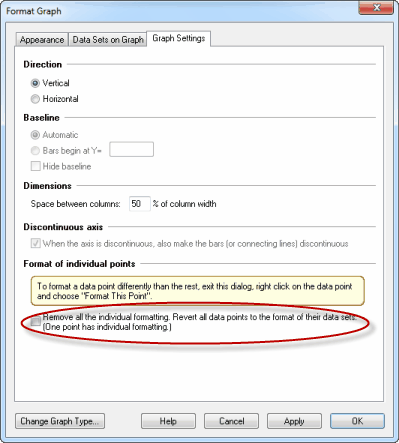
Revert individual formatting back to data set format
Open the Format Graph dialog by double clicking on the graph. Go to the Graph Settings tab, and check the option to "Remove all individual formatting."