Nudge overlapping data sets to make a graph easier to understand.
Double-click on any data point to open the Format Graph dialog. Use the bottom of the Data sets on Graph tab to nudge a data set.
Nudging adds a specified value to each X and Y coordinate before graphing. Use this feature cautiously, as it means that the position of the symbol on the graph will not match the actual X and Y values of the data point.
The values you enter are the actual increments of X and Y. Each data set is incremented as much as you specify. The nudging is not cumulative
Nudging can be helpful to differentiate datasets that otherwise overlap a lot. For example, the data in the following graph overlap so much it is impossible to tell which tracing is which.

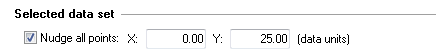
 The graph below is an alternative way to plot the same data. The second data set is nudged by 25 units in the Y direction (and not at all in the X direction).
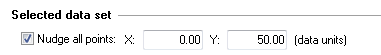
The third data set is nudged 50 units in the Y direction (with zero in the X direction).
Now you can see the individual tracings.
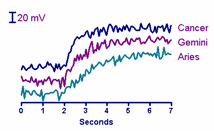
All three tracings still have about the same baseline Y coordinates. But nudging the data in the Y direction separated them. Because the Y values were nudged, it would be misleading to plot the data on a full Y axis as in the graph above. So instead, the Y axis is hidden (Frame and Origin tab of the Format Axes dialog) and replaced with a scale bar.
Waterfall graphs
Nudging can also help you create a waterfall graph. All the data sets in the following graph cover the same range of wavelengths, and all have a baseline of zero optical density. Each data set was nudged in both X and Y directions, each data set nudged a bit more than the previous data set. This creates a pseudo 3D look that is sometimes called a “waterfall” (but note that "waterfall" can also refer to a column graph where the columns are sorted by height; Prism cannot automatically make such a graph but you can sort the order of columns in the middle tab of Format Graph dialog).
