There are two options to choose from in the Fill Color section, each of which will be discussed in its own section on this page:
•One color for the entire graph
•Variable
Note that these options operate similarly to the options for Color.
One size for the entire graph
Select a single symbol size that will be applied to ALL symbols plotted on the graph.
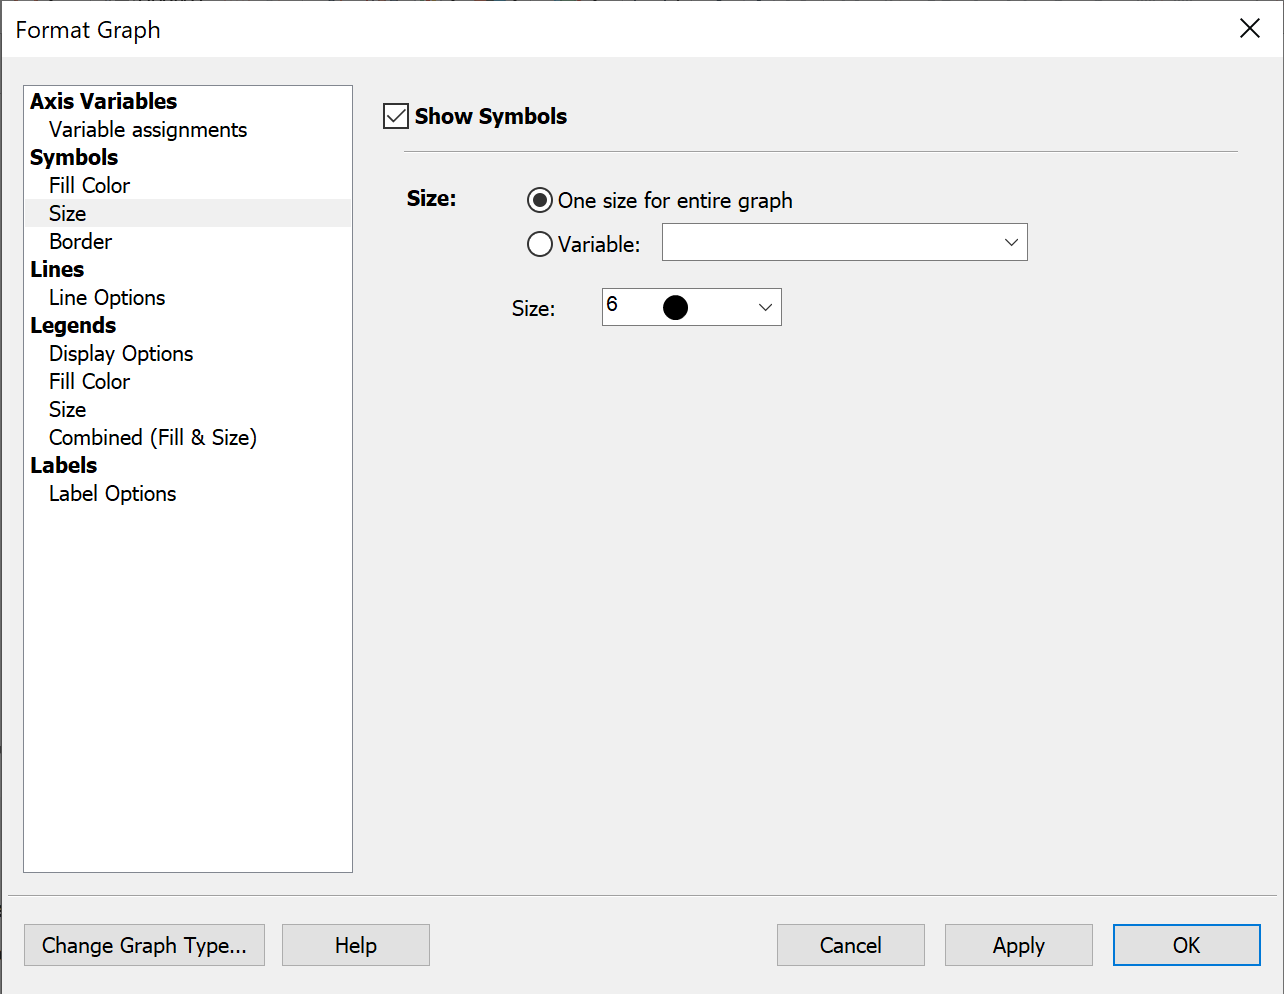
Variable
Select a variable to define symbol size on the graph. This variable can be either categorical or continuous.
Categorical Variable
If choosing a categorical variable, each level of the selected categorical variable will be treated as its own group, and can be assigned its symbol size using the Size dropdown menu. Additionally, multiple groups (multiple levels of the selected categorical variable) can be selected at once using the Global dropdown menu.

Continuous Variable
If choosing a continuous variable, symbol sizes are calculated such that the area of the plotted symbol is proportional to the value in the specified continuous variable for that symbol. In other words, a symbol with a value in the specified variable of 10 will have an area that is ten times larger than a symbol with a value of 1 in the specified variable.

After selecting the continuous variable that will determine the symbol size, you may also choose to customize the way that the size scale is represented. To do this, you may first select the Size of smallest symbol that will be plotted on the graph using the dropdown menu (Tip: if your values are very spread out, we recommend using a very small symbol size so that other symbols don’t become huge). Next, you may also choose to specify a Value of smallest symbol to be plotted on the graph. By default, the smallest symbol plotted on the graph will correspond to the row with the smallest value in the selected variable. However, you may also choose Custom to specify a value to correspond to the smallest plotted symbol.
•Note that if you choose a value smaller than any value in the specified variable, all of the plotted symbols will be larger than the symbol size selected in Size of smallest symbol
•If you choose a value greater than the smallest value in the specified variable, you must also specify how Prism should handle values Smaller values than this Custom value. There are two options:
oDisplay at the minimum symbol size. This will make any symbol with a value smaller than the specified value the same size as specified in the Size of smallest symbol dropdown.
oOmit from the graph. This will cause any symbol with a value smaller than the specified value to not be shown on the graph at all.
Symbol size determined using AREA, not RADIUS
It’s very important to emphasize that when using a continuous variable to define symbol size, it is the symbol areas - not symbol radii - that are proportional to the value in the specified variable. A symbol with a value of 4 will have twice the area of a symbol with a value of 2. The symbol with the value of 4 will NOT be twice as wide as the symbol with a value of 2.
What if the symbols are too large for the legend?
In order to keep the symbol size legend of a multiple variable graph from becoming too large, there is a maximum symbol size that will be displayed in the size legend. In the event that a symbol on a multiple variable graph is larger than this maximum size, the largest symbol in the legend will simply be displayed at the maximum allowed size, and include a red dotted outline.
The value displayed for this legend symbol will be calculated by Prism based on the area of the symbol displayed (remember, the area of a symbol is directly proportional to the value in the size variable). However, this means that there will be values on the graph that are larger than the largest symbol in the legend. Because of this, a “greater than or equal to” sign (≥) is included with the maximum value in the legend.
How is the size of the middle symbol in the size legend determined?
Recall that the area of a symbol is proportional to the value it represents. The smallest symbol in the size legend is defined (either as the smallest value on the graph or by a specified value in the Format Graph dialog). The largest symbol in the size legend is either the maximum symbol size on the graph or the maximum symbol size allowed by the size legend, whichever is smaller. Either way, the value of the largest symbol can be calculated directly from its area.
But how is the area of the middle symbol in the legend calculated? First, Prism calculates a value for this symbol using the following formula:
Valuemiddle = sqrt(Valuesmallest * Valuelargest)
Using this value, Prism then determines what the area of this middle symbol should be, and generates an appropriately sized symbol. In other words, the value is the geometric mean of the smallest and largest value, and the symbol area is the geometric mean of the smallest and largest areas.