One very important goal when performing Cox proportional hazards regression may be to predict the survival probability for a given individual in the examined population, provided values for this individual’s predictor variables are known. In order to do this, a baseline cumulative survival curve and baseline cumulative hazard curve are estimated. The process of estimating these curves is mathematically complex, but can be thought about in the following way:
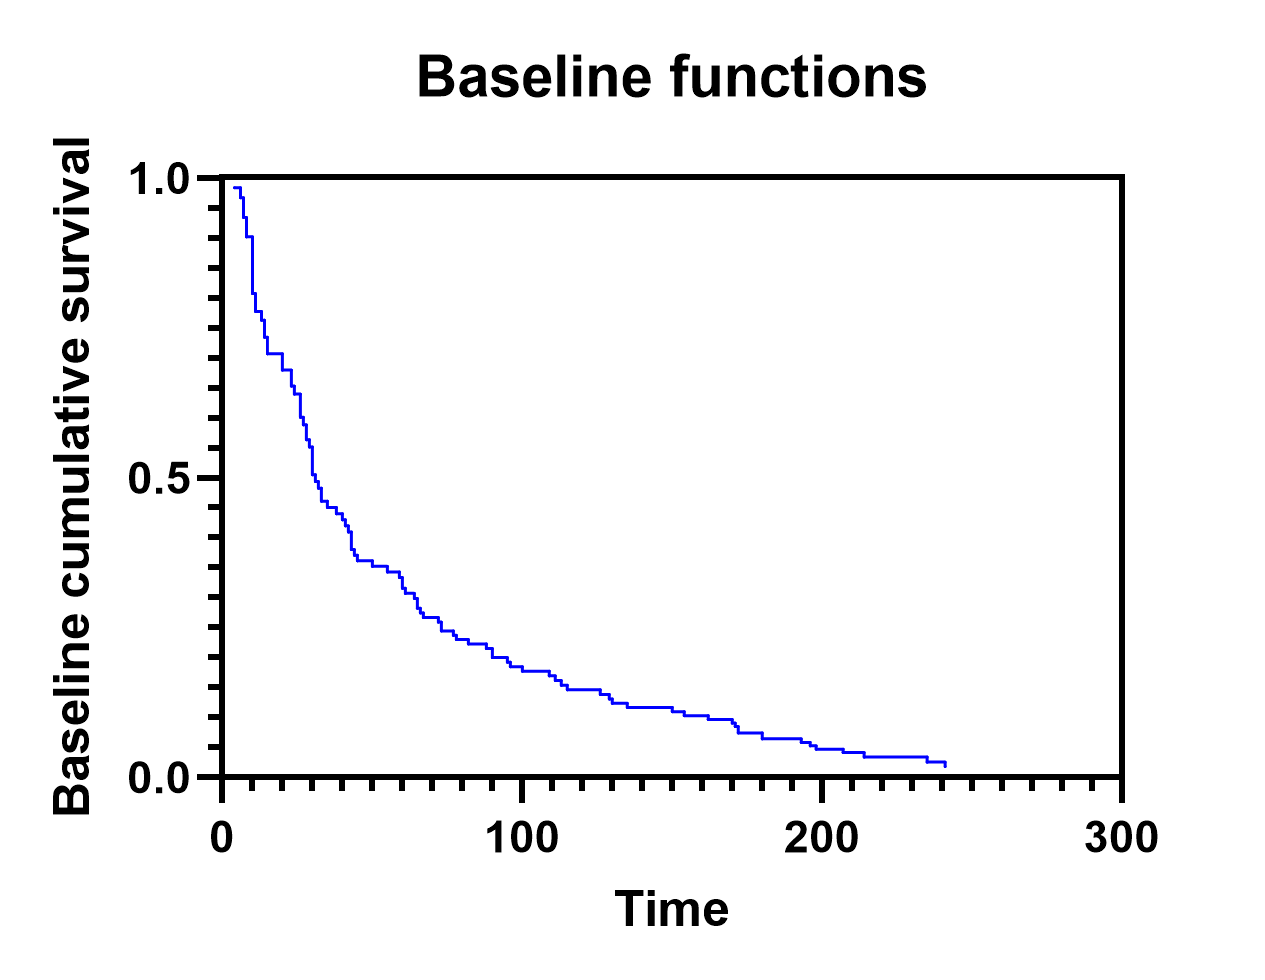
•The baseline cumulative survival is the estimated cumulative survival of an individual whose predictor variables all had values of zero
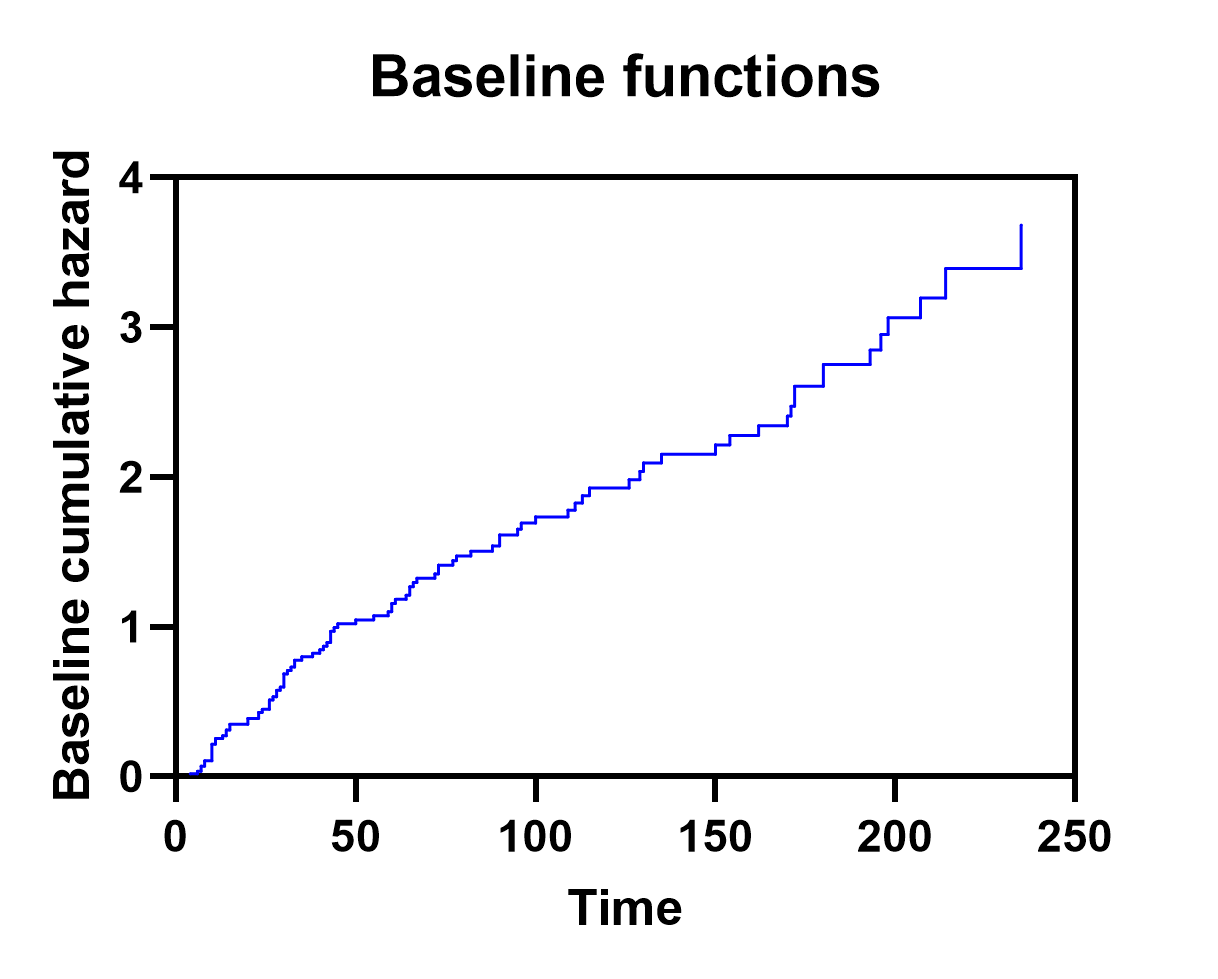
•The baseline cumulative hazard is similarly the estimated cumulative hazard of an individual whose predictor variables all had values of zero
To calculate these values, Prism must first calculate a quantity known as alpha (α). The complete mathematical explanation of alpha is beyond the scope of this text. However, the general concept is the following:
•Order the observations of the input data by ascending values of elapsed time to event
•For each time, consider the relative risk values (exp(XB) for individuals experiencing the event of interest as well as those still considered “at risk” (those individuals that have not experienced the event of interest or been censored by this time)
•Calculate alpha using the ratio of the values for those experiencing the event of interest and those who are at risk
•Note that alpha for censored observations is equal to one by definition
Once alpha has been calculated for each time point, calculating the baseline cumulative survival and baseline cumulative hazard values is straightforward, and not mathematically complex:
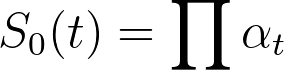
That is, the baseline cumulative survival at time t is equal to the product of all alpha values for times up to - and including - time t. To confirm these results in Prism, select a row in the baseline cumulative survival column of results. Multiply together the alpha value on this row together with the alpha values on all rows before this row. The result of this product will be the same value as the baseline cumulative survival.
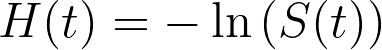
Values of the baseline cumulative hazard are even more straightforward in terms of their calculation, and can be determined using the following equation:
After calculating the baseline cumulative survival and baseline cumulative hazard for each time point in the input data, Prism will also generate a graph in which these curves can be examined. In the Navigator, select the graph associated with the analysis titled “Baseline values: Multiple Cox regression”. By default, the Baseline cumulative survival will be plotted on the Y axis, but double clicking on the graph will allow you to access the Format Graph dialog, and to change the assignment of the Y axis variable to display the baseline cumulative hazard instead.