After performing Cox proportional hazards regression, a model is fit that provides relationships between the predictor variables in the model and the estimated hazard rate. These relationships are summarized by the parameter estimates for each of the predictor variables.
Once the model has been defined, additional information can be provided for each of the original individual observations in the input data table. These values can be found on the Individual values tab of the results, and the rows in this table correspond to the rows of the input data table (the observation on row one of the data table corresponds to row one of the Individual values results table, and so on). Specifically, for each individual observation, the following values are reported:
•Linear predictor, XB - this is the value calculated for Σxi*βi after entering in the estimated parameter estimates and the values for each of the predictor variables for each individual. This value indicates how much the estimated log(hazard rate) changes from the baseline hazard for the individual observation
•Hazard ratio, exp(XB) - this is simply the exponentiated linear predictor (XB). This value is the multiplicative scalar used to determine the hazard rate for the individual from the baseline hazard rate, or the cumulative survival for the individual from the baseline cumulative survival. Cox regression relies heavily on the proportional hazards assumption (that the hazard rate for any individual is proportional to some unknown baseline hazard). This relative risk value (exp(XB)) represents that proportionality (how many times greater or less is the hazard of this specific individual than the baseline hazard)
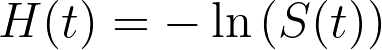
•Cumulative hazard (H(t)) - this is the cumulative hazard estimated by the model for the individual at the given elapsed time of the observation (the total accumulated risk up until time t). Higher values of cumulative hazard correspond to lower values of estimated cumulative survival probability (see below). This value is important for a number of mathematical/computational reasons (and so is included in the results table), but is not easily interpretable directly. The relationship between cumulative hazard and cumulative survival can be seen using the following formula:
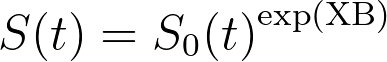
•Cumulative survival (S(t)) - this is the survival of the individual estimated by the model, given the elapsed time of the observation. This value indicates the probability that an individual would survive to this time, assuming they had the same values for each of the predictor variables as this observation. This value is calculated from the baseline survival function (see this page on baseline values) using the following formula:
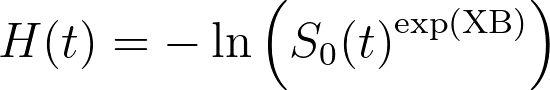
Note, using the two equations provided above, the value estimated by the model for the cumulative hazard for an individual can be calculated directly from the baseline survival function and the linear predictor (XB) value: