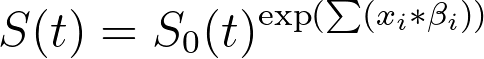
The Graphs tab of the Cox proportional hazards regression analysis parameters dialog is used to generate graphs that visually represent estimated survival probabilities for specified groups over time. It is important to note that these estimated survival curves are generated from the MODEL defined in the analysis, and do not represent survival curves that would be generated using a selection of the data to perform Kaplan-Meier survival analysis. Instead, these survival curves are generated using a critical assumption of Cox regression: specifically that the hazard for any individual (or group of individuals defined by a set of predictor variables) is proportional to some baseline hazard. A consequence of this assumption is the fact that the estimated survival curves will all possess the same basic shape (including the fact that they all have "steps" at the same time points). This is because each estimated survival curve is calculated using the baseline survival (discussed on this page). The relationship between the estimated survival for a given individual/group with a specific set of predictor variables and the baseline survival is given as:
Instead of using the parameter estimates, this equation can be rewritten using the hazard ratios for each predictor variable:
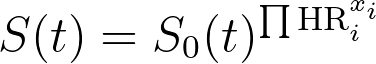
Essentially, this means that the estimated survival at all times for a given individual or group (with a specified set of values for the predictor variables in the model) will be proportionately higher or lower than the baseline survival. Changing the value of the predictor variables won’t ever change the overall shape of the estimated survival curve, it will only change the proportionality of the new estimated survival curve to the determined baseline survival curve.
When specifying the predictor variables that Prism should use when generating estimated survival curves, there are two concepts that you should remember:
•If a predictor variable is not specified, the estimated survival curve is generated assuming that this variable takes on its baseline value
•Prism will automatically determine all possible combinations of specified predictor variable values and generate an estimated survival curve for each combination
Consider a model where age is included as a continuous predictor variable (without centering the data first). The baseline value for this variable is zero (because it is continuous). When generating estimated survival curves, if a value for age is not specified, the resulting curve will represent the estimated survival when age equals zero. In most cases, this likely won’t be very meaningful (similar for a weight or height of zero, for example). Thus, if a continuous variable is identified as being an important predictor in the model, you should consider including a value for this variable when specifying estimated survival curves.
When categorical variables are used to specify estimated survival curves, there may be many different possible combinations of levels that could define different groups. Consider two categorical variables:
•Sex, two levels “Female” and “Male”
•Treatment_Group, three levels “Control”, “Standard Treatment”, and “Experimental Treatment”
Using these two categorical variables, it is possible to define six different groups:
1.Females in the Control Group
2.Females in the Standard Treatment Group
3.Females in the Experimental Treatment Group
4.Males in the Control Group
5.Males in the Standard Treatment Group
6.Males in the Experimental Treatment Group
Instead of having to define all six of these combinations manually, simply select the two variables (and appropriate levels for each variable) in the parameters dialog, and Prism will automatically determine the number of individual estimated survival curves required for the graph. In the example above, adding a third variable for blood glucose concentration with levels “Low”, “Medium”, and “High” would increase the total number of combinations to 18. But with Prism, you’ll only need to select the three variables (and levels) instead of manually specifying all 18 different combinations.