The objective of Cox proportional hazards regression is to generate a model of the hazard rate for a given event occurring within a population. This population is defined by a variety of different predictor variables that are used in the model to estimate this hazard rate. And from this hazard rate, the survival function for the studied population can be estimated. There are numerous assumptions that are made when performing Cox proportional hazards regression, and you should be aware of these assumptions when performing this analysis. On this page, you'll find a number of important questions to ask when conducting Cox proportional hazards regression or interpreting the results of this analysis.
 Are the hazard functions for each group proportional?
Given the name of this analysis, it only makes sense to start by asking if the assumption of proportional hazards is valid. This assumption essentially states that there is one - and only one - underlying baseline hazard function that applies to the entire population of observations. The hazard rate for any given individual (or group of individuals) is simply a scaled version of this baseline hazard function. The amount of scaling applied to this baseline hazard function is based on the values of the predictor variables in the model for this individual (or group). If the proportional hazards assumption is true, then an individual that has a hazard of 3x the baseline hazard at one time point would have a hazard of 3x the baseline hazard at all time points. This also means that the ratio of hazards between any two individuals or groups must remain constant at all times. If the ratio of the hazard for men to the hazard of women is 2.5, this means that men have a 2.5-times greater hazard of experiencing the event of interest at all times. This is a fairly large assumption, and may not always be strictly true given the complexity and variability of biological systems. To test this assumption, log-minus-log plots can be created (use the Residuals tab of the Cox regression parameters dialog in Prism to create these graphs).
If the assumption of proportional hazards has been violated, there are some methods that can be used to try and account for this. One common way is to perform stratification of the model using the variable(s) that violate the PH assumption. Once identified, the input data are split into new groups based on the levels of this variable. After this, a Cox proportional hazards regression model is fit to each of the new groups individually. This process is sometimes referred to as fitting a "stratified Cox model". However, Prism does not offer options to perform this automatically.
Are the data organized correctly?
In order to perform Cox proportional hazards regression in Prism, the data must be entered into a multiple variables data table. For this table, each column is a variable, and each row is an observation. For each observation (row), a value must be entered for:
•The time to event (response) variable
•The event/censor (outcome) indicator variable
•Each predictor variable included in the model
If a row is missing a value for any of these variables, it will be omitted when fitting the model. Note that observations (rows) missing a value for the event/censor variable will not be used to fit the model, but may still be used after the model has been fit to calculate an estimated survival probability (if a value for the time to event variable was provided for this observation) using the Predictions tab of the parameters dialog.
Should my Cox proportional hazards regression model have an intercept term?
No! Unlike multiple linear regression, there is no intercept term for Cox proportional hazards regression. The mathematical justification for this is not shown here, but the general explanation is that - because the baseline hazard (h0(t)) is undefined, any constant intercept term added to the model would simply be "absorbed" into this baseline hazard. Thus, no intercept is needed (or allowed) when defining a model for Cox proportional hazards regression.
Was the censoring non-informative?
In survival analysis, some observations or individuals are censored, meaning that we do not have information on the amount of elapsed time until they experience the event of interest (we only have information on the amount of time elapsed until they were censored). However, an assumption that is made with Cox regression (as well as other forms of survival analysis) is that there is no relationship between an observation being censored and the probability of an individual dying (experiencing the event of interest). Observations that are censored should not be more (or less) likely to experience the event of interest. In other words, this assumption suggests that - if the observations that were censored were actually followed until they experienced the event of interest - that this distribution of survival times would be the same as the distribution of survival times observed for observations that were not censored.
Non-informative censoring also means that the reason an observation was censored should not be related to the study design. Consider a clinical study investigating an experimental drug. The effects of the drug may be so good that individuals in the treatment group may consider themselves to be "cured" and no longer need to follow-up (resulting in these individuals being censored). Those in the control group would not experience this improvement and would continue to participate in the study. Because of the high rates of censoring in the treatment group vs. the control group, the actual survival time in the treatment group may not be accurately recorded, and the treatment effect may not be discovered. Alternatively, a treatment should not cause patients to feel so badly that they choose to drop out of the study (this would also not be considered non-informative censoring).
Are the survival times for each observation independent?
As with many regression techniques, an important assumption is that the observations are independent from each other. In the case of Cox regression, it's important that the survival times for each individual be independent. In other words, the survival time of individual 1 should not depend on the survival time of individual 2.
Are the (continuous) predictor variables linear with respect to the log hazard?
Another assumption of the Cox proportional hazards regression model is that the effects of the predictor variables are linear with regard to the log hazard. That sentence may sound confusing at first, but consider the equation used in Cox regression for the hazard rate (h(t)):
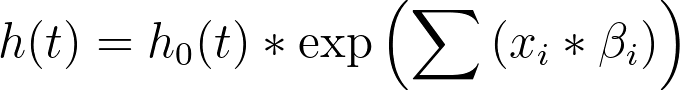
With a bit of re-arrangement and simplification, this same equation can be written as the following:
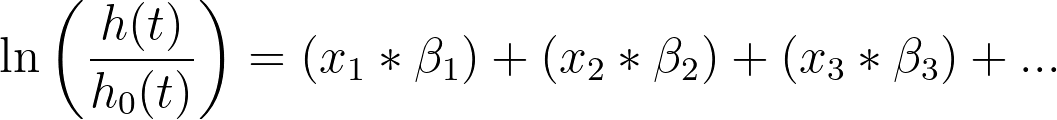
In this form, it's easier to see that the predictor variables (x1, x2, x3, etc.) are assumed to have a linear effect on the log hazard. There are ways to check this assumption, such as using the deviance residuals and plotting them against the values of the predictor variable (this graph can be generated using the options of the Residuals tab). Using this graph, we would expect to see no pattern in the residuals with respect to the values of the predictor variable (the residuals should be evenly centered around zero).
In situations when predictor variables exhibit nonlinearity, there are some methods that can be used to try and correct for this violation of the linearity assumption. As with other regression techniques, one solution may be to transform the variable (using a logarithmic or exponential transformation for example). Other possibilities may be to include a polynomial term of the variable in the model, or to convert the continuous variable to a categorical variable.
Are the values of predictor variables for individuals constant over time?
An interesting assumption of Cox proportional hazards regression is that the values of the predictor variables do not change over time. Individuals in studies analyzed with Cox proportional hazards regression are necessarily followed for different periods of time (in order to determine the elapsed time until the event of interest for each individual). However, it is important that the predictor variables do not change during this time. For example, if "Treatment" is a predictor variable with a "Control" and "Treatment" group, it is important that individuals not swap between these groups during the study (an individual in the "Treatment" group should always be in the treatment group). In other types of multiple regression (for example, multiple linear regression), there is no time component to the data, and thus this assumption is not needed. However, because of the nature of the data for Cox regression, its important that this assumption is valid.
Are the predictor variables linearly dependent (with each other)?
If the predictor variables in a model exhibit high multicollinearity, the estimated standard errors and P values will be meaningless. Read more about multicollinearity and how Prism reports on this relationship between model variables.
Do you have sufficient data to trust your results?
In general with stats modeling, the more data the better. However, sample or population sizes may often be limited due to various constraints. The Data Summary section of the Tabular results sheet includes a number of important summary statistics from the input data. Among these, the number of events in the data, the number of parameters fit by the specified model, and the ratio of these two values can be used to assess if there is "enough" data to support the selected model. There is no specific value that can be used to definitively state that a given model has "enough" data, but a general rule of thumb is that there should be at least 10 events per parameter that has been fit in the model. Note that this is not the ratio of observations (censored and event), but only the number of events per parameter. Also be aware that the denominator of this ratio is the number of parameter estimates in the model, which may be greater than the number of variables (due to the inclusion of categorical variables with more than two levels or interactions in the model).
Are you overfitting or underfitting?
Similar to the point above, does the model that you've specified include too many variables (overfitting) or too few variables (underfitting)? After fitting a specified model to the data, it may be that some of the included predictor variables do not contribute to changes in the hazard (in other words, their beta coefficients are close or equal to zero or their hazard ratios are close or equal to one). If the values of these variables do not contribute to changes in the hazard, do you want to include them in the model? In some cases, it's important to retain these variables due to their importance in the experimental design or based on your knowledge of the experiment and science involved. In other cases, it may simply be worth removing this variable from the model, though this is a controversial topic, so don't do this without a lot of thought.
On the other side of things, the fit of the model may not be as good as desired. This could be due to an important variable that you either didn't measure or chose not to include in the model. In this case, the model is said to "underfit" the data. If the missing variable is one that you didn't measure in the experiment, there's not much you can do but go back out and collect more data. However, if the missing variable was simply omitted from the model, you may want to reconsider why this variable was removed. Additionally, you can use the Model tab of the parameters dialog to include various transformations and interactions of the predictor variables in the model.