Features and functionality described on this page are available with Prism Enterprise. |
Prism will automatically generate a Number at Risk table to accompany the graph of survival curves generated by the Kaplan-Meier survival analysis. The Prism User Guide provides details about how this table can be customized. The remainder of this page simply explains the various components of the Number at Risk table and the information that each of them provide.
Adding or removing the number at risk table
To add a number at risk table to an existing graph of survival data, simply click the Number at Risk Table button in the Draw section of the primary toolbar. Alternatively, open the Insert menu and select "Number at Risk Table...". To remove an existing number at risk table (or placeholder when the feature is restricted), simply click on the table and press the delete key.
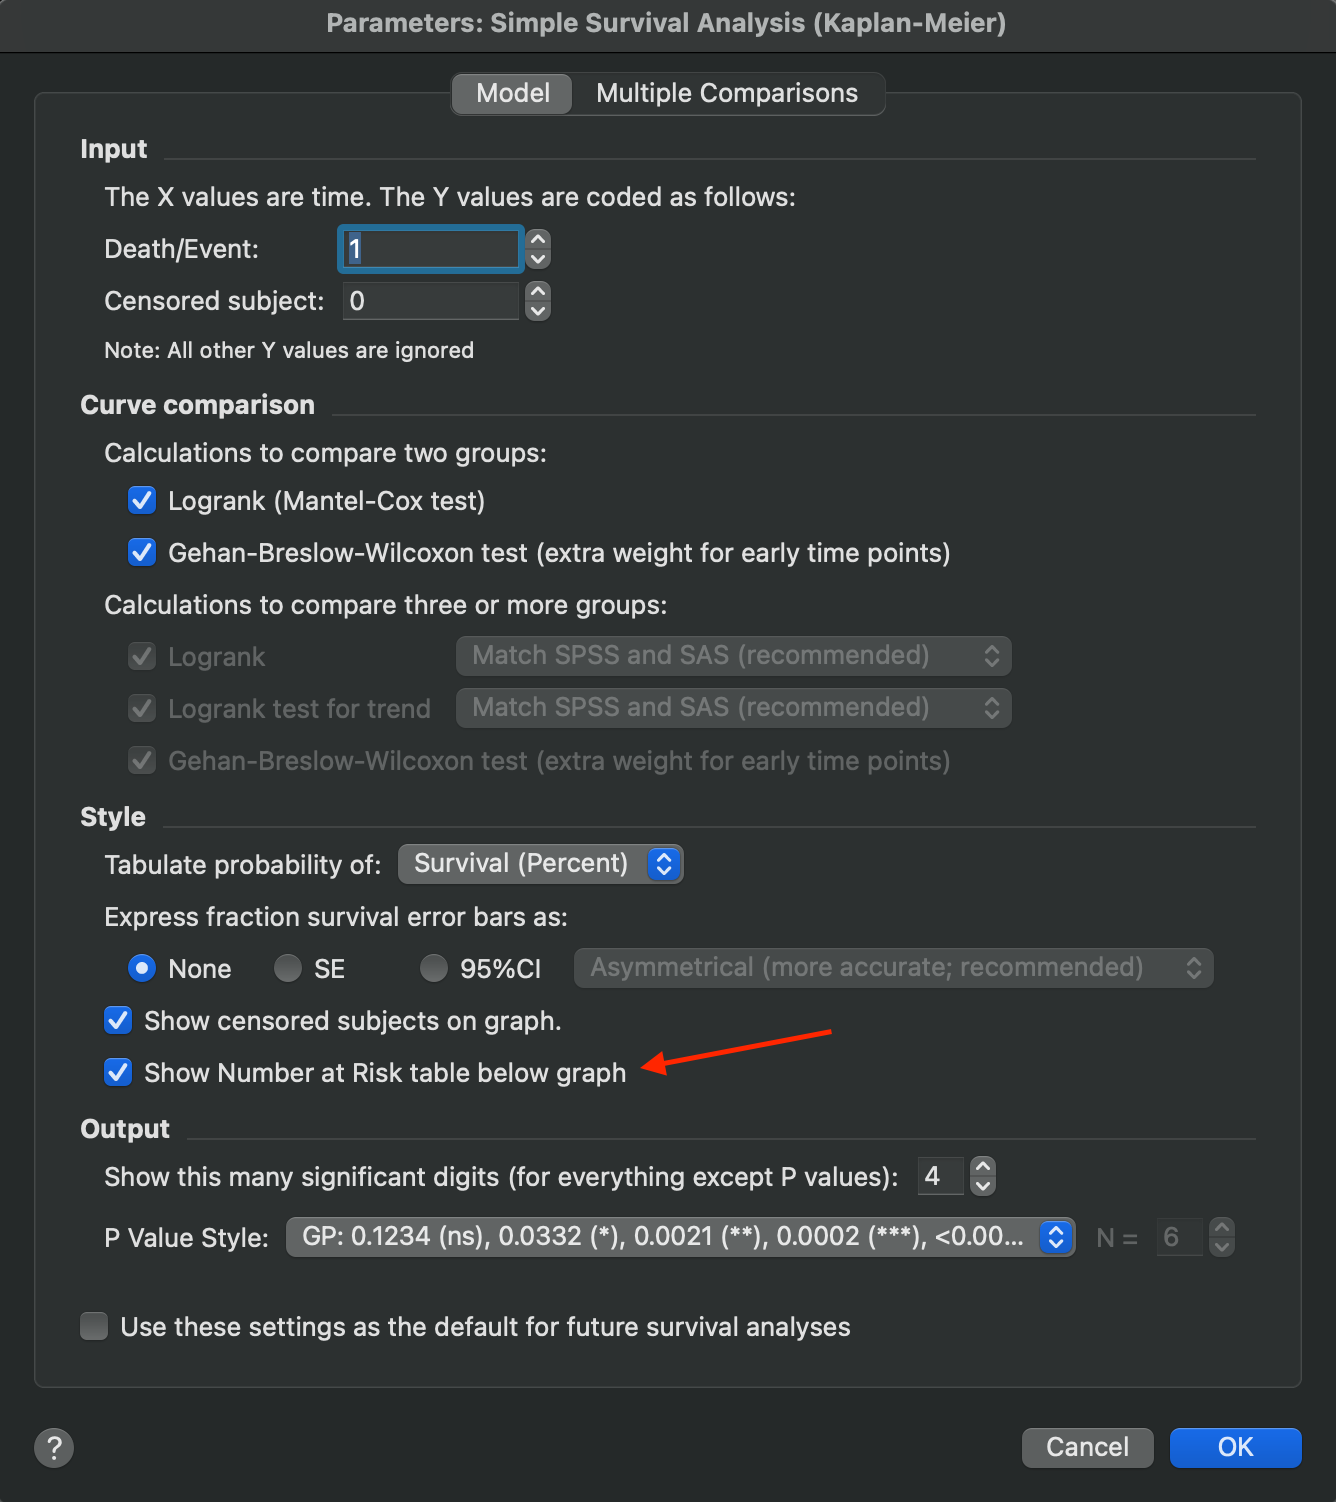
It's also possible to specify whether a number at risk table should be added to the graph at the level of the Kaplan-Meier survival analysis parameters. Simply open the analysis parameters dialog, and check the option "Show Number at Risk table below the graph"
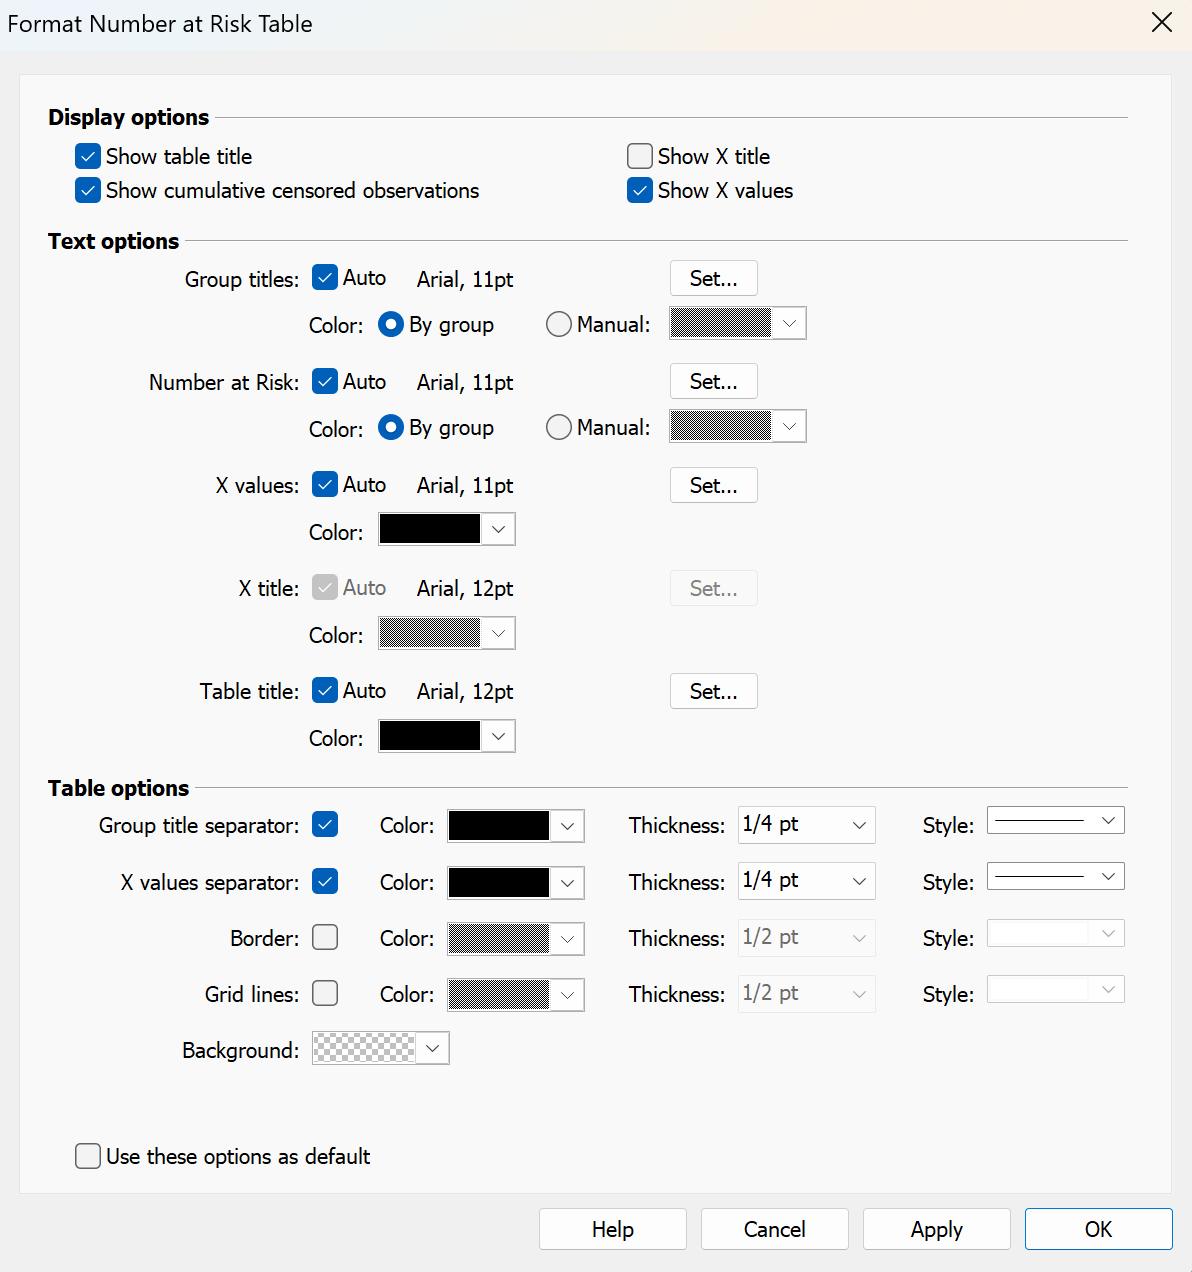
The format number at risk table dialog
The format number at risk table dialog contains all of the controls for customizing the visual properties of the number at risk table. The Prism User Guide provides an overview of how each of these controls can be used to customize the appearance of the table.
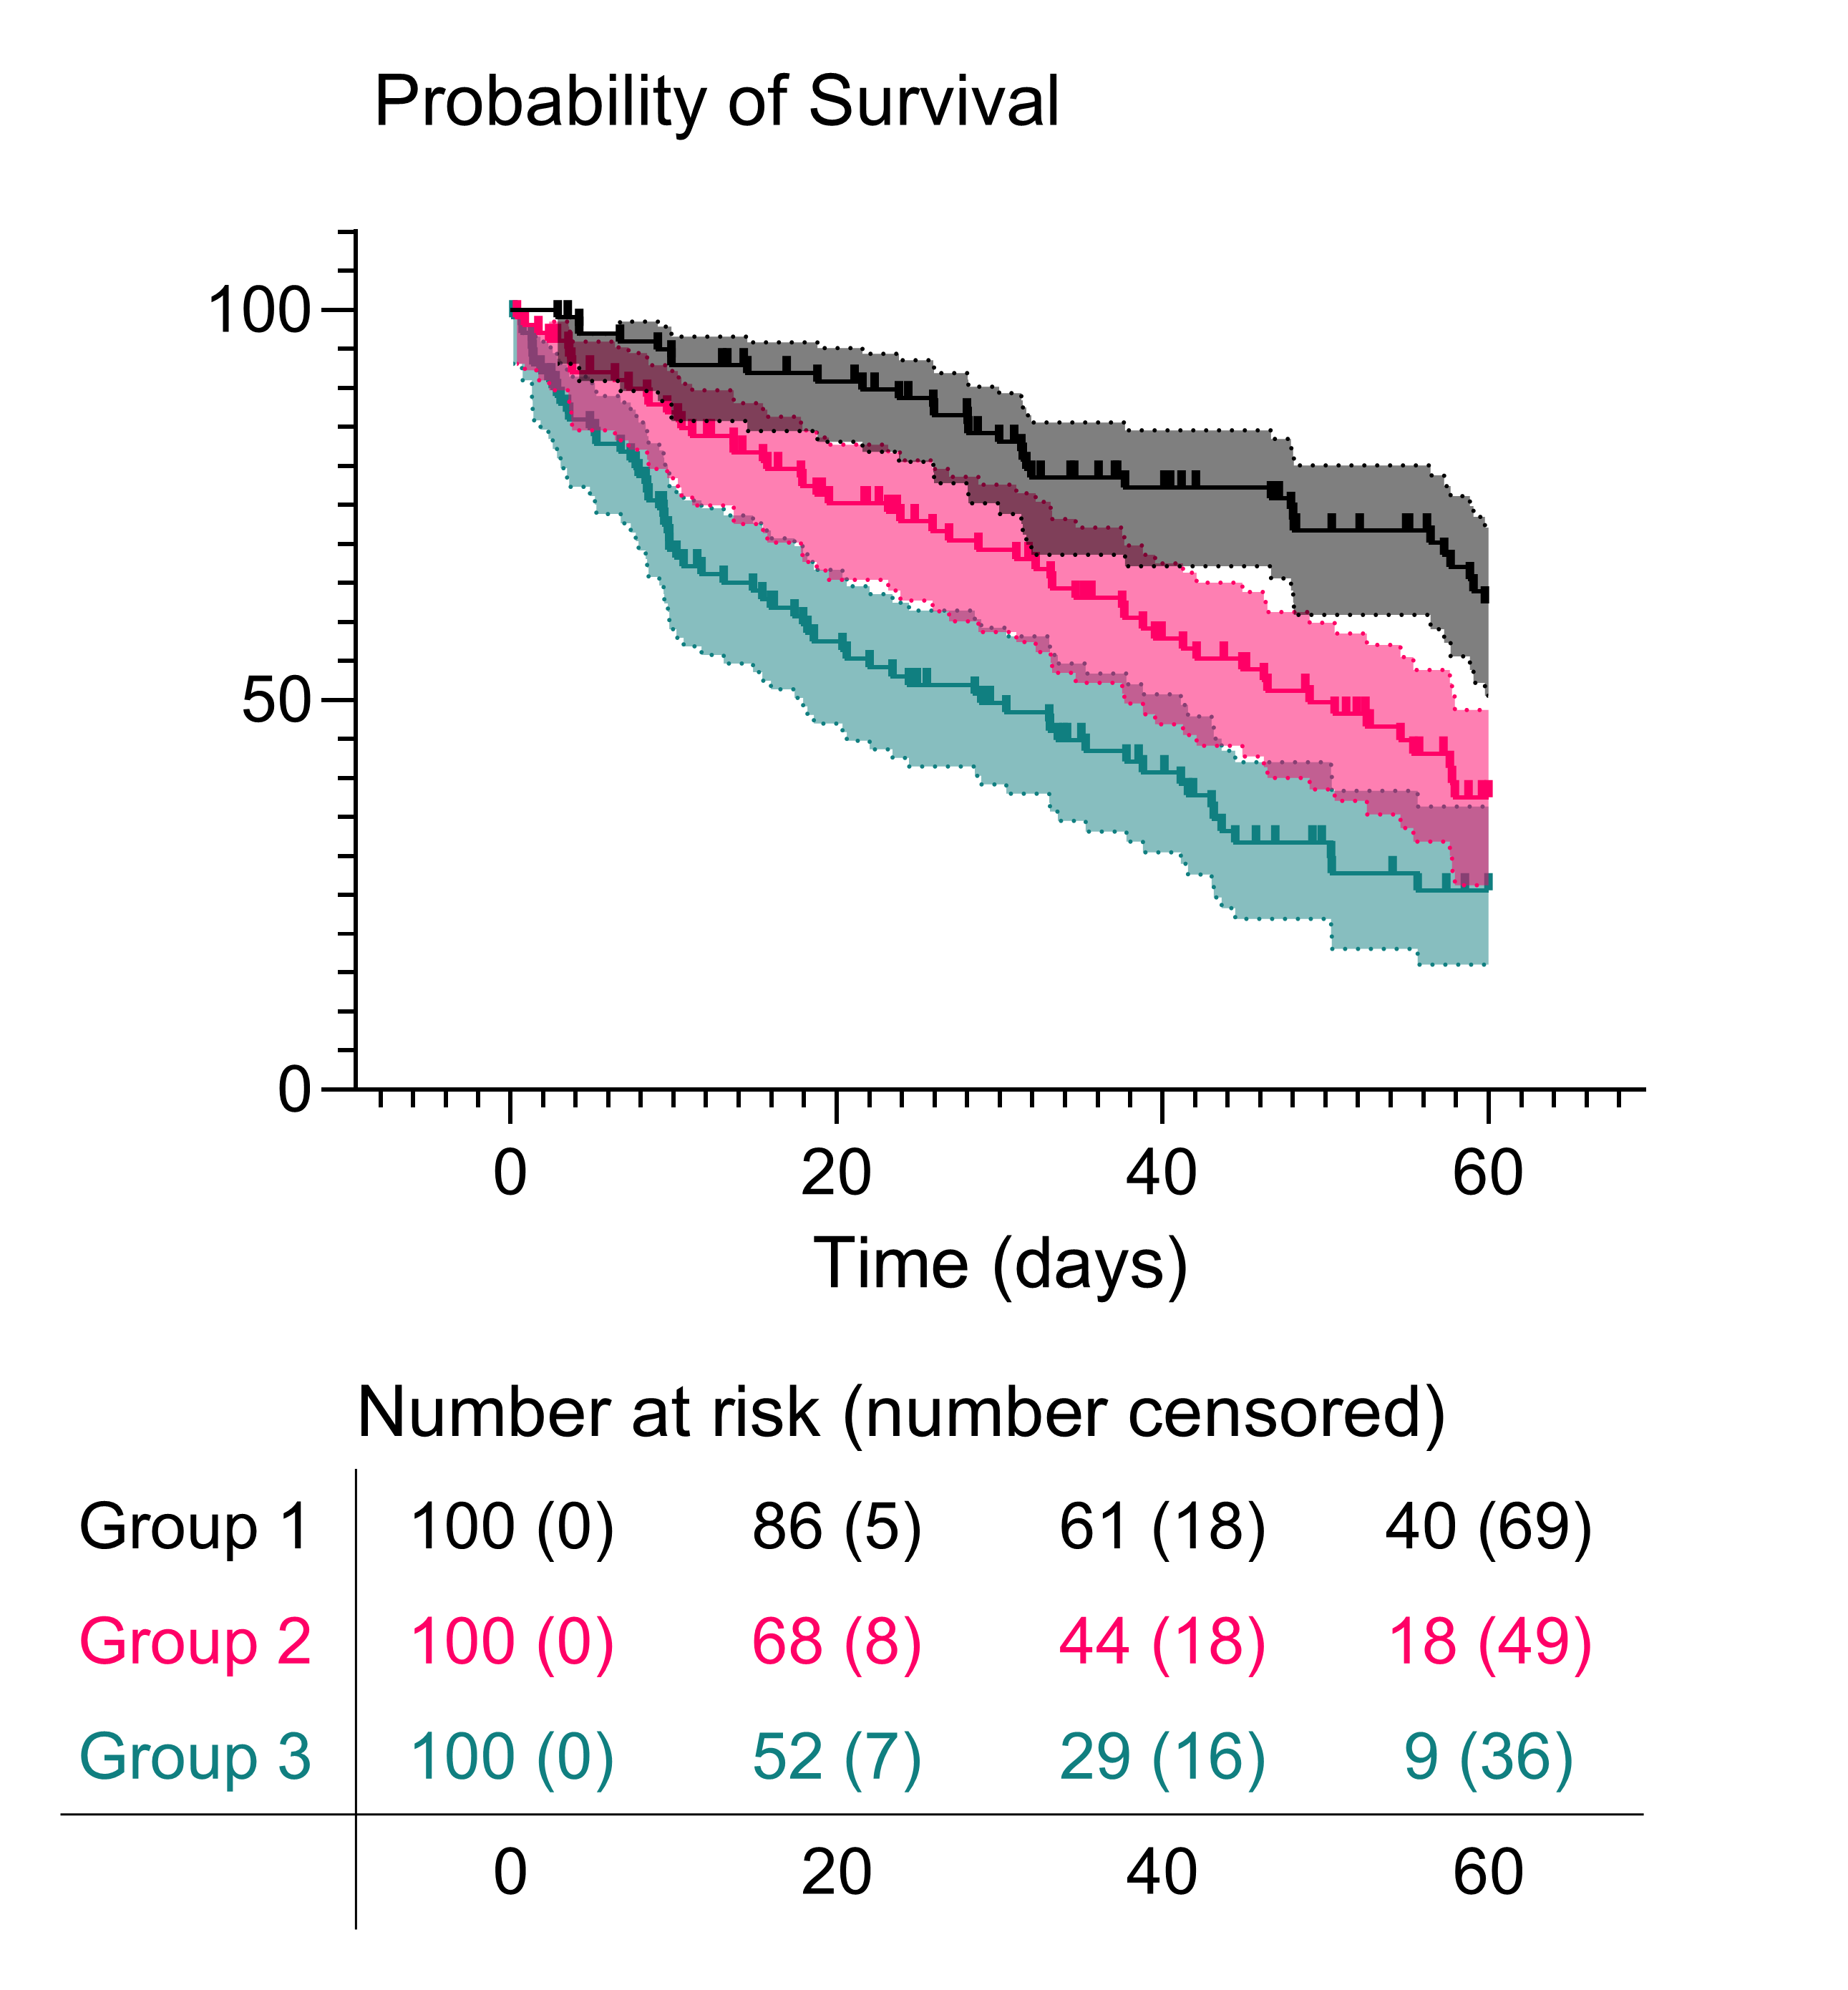
Number at risk values
These values show how many individuals in each group (row) are at risk at each of the given time points. In Kaplan-Meier survival analysis "Number at risk" refers to the number of subjects who remain in the study and are still being followed at specific time points. Another way of phrasing this is that the "Number at risk" for a given group at time t is the number of subjects in that group that either have not experienced the event or were censored prior to time t. The number at risk for a given time point includes individuals that either experience the event or are censored at that time. Calculating the number at risk is a critical component of how Kaplan-Meier survival analysis works.
Cumulative censored count values
These values show the total number of individuals in each group (row) that have been censored up to - and including - the given time point. Censoring may occur for a variety of reasons including survival past the end of the study, loss to follow-up, and others. The cumulative censored count does not include any individuals who were observed to experience the event. This value can be useful when assessing a survival analysis as it informs the observer how much information that has been "lost" due to censoring up to that point in the study.
X values
These values mirror the major tick values on the X axis of the corresponding survival graph. Because the table values and alignment are automatically updated, you may find it sufficient to disable these values and simply rely on a single set of X values for both the graph and the table.
Group titles
These correspond to the group titles of the corresponding data table. By default, these will match the graph legend. However, changing the legend text for a group will NOT change the titles of the number at risk table. You must change the name of the group on the data table for the change to be reflected on the number at risk table.
Table title
This will either read "Number at risk" or "Number at risk (number censored)" depending on what the table itself is showing. There are (currently) no options to change this title.