Repeated measures defined
Repeated measures means that the data are matched. Here are some examples:
•You measure a dependent variable in each subject several times, perhaps before, during and after an intervention.
•You recruit subjects as matched groups, matched for variables such as age, ethnic group, and disease severity.
•You run a laboratory experiment several times, each time with several treatments handled in parallel. Since you anticipate experiment-to-experiment variability, you want to analyze the data in such a way that each experiment is treated as a matched set. Although you don’t intend it, responses could be more similar to each other within an experiment than across experiments due to external factors like more humidity one day than another, or unintentional practice effects for the experimenter.
Matching should not be based on the variable you are comparing. If you are comparing blood pressures in three groups, it is OK to match based on age or zip code, but it is not OK to match based on blood pressure.
The term repeated measures applies strictly only when you give treatments repeatedly to one subject (the first example above). The other two examples are called randomized block experiments (each set of subjects is called a block, and you randomly assign treatments within each block). The analyses are identical for repeated measures and randomized block experiments, and Prism always uses the term repeated measures.
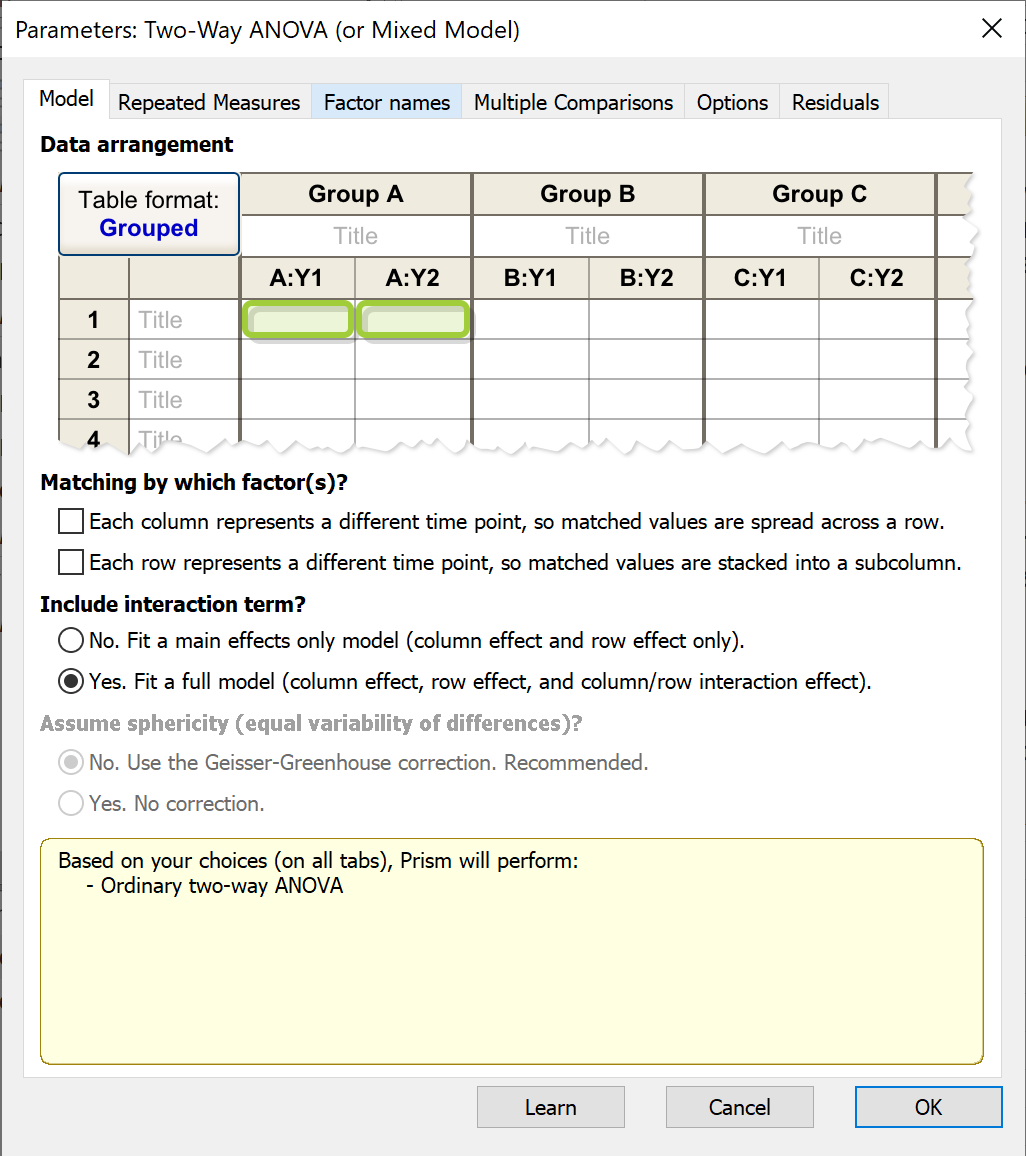
Matching by which factor(s)?
If your data are matched, choose which of the two factors are repeated measures, or if both factors are repeated measures. If one factor is repeated measures and the other is not, this analysis is also called mixed effects model ANOVA.
Choose carefully, as the results can be very misleading if you make a choice that doesn't correspond to the experimental design. The choices are:
No matching. Use regular two-way ANOVA (not repeated measures).
|
Each column represents a different repeat, so matched values are spread across a row.
|
Each row represents a different time point, so matched values are stacked into a subcolumn.
|
Repeated measures by both factors.
|
Take your time when making this choice.We find that too many people think "repeated measures" but don't take the time to carefully specify which factor is repeated or if both factors are repeated. If your choice here doesn't match your actual experimental design, the results will probably be incorrect.
Include an interaction term?
Choose to fit a full model (including a column effect, row effect, and column/row interaction effect) or a main effects only (column and row effect, no interaction) ANOVA model. Knowing which of these options to select depends on if there is an interaction effect within the experiment, and is strictly a scientific decision that must be based on knowledge of the experiment and the data.
To better understand the concept of interactions, consider the following hypothetical experimental design. You're interested in the effect of an experimental medication on blood pressure, so you recruit a group of both men and women, and you prepare the medication and a placebo. In order to conduct this experiment, you organize the participants into the following groups:
1.Women receiving the placebo
2.Women receiving the medication
3.Men receiving the placebo
4.Men receiving the medication
In this experimental design, there are two "main effects", the effect of treatment (placebo vs medication) and the effect of sex (Women vs Men). For example, you may expect that blood pressure is lower for those taking the medication compared to those taking the placebo (main effect of treatment). You may also expect that blood pressure is lower for women than it is for men (main effect of sex). These effects can be tested using the following hypotheses:
•For the effect of treatment, you would test the hypothesis that the blood pressure of individuals receiving the placebo is the same as the blood pressure of individuals receiving the treatment (ignoring differences in sex of these individuals).
•For the effect of sex, you would test the hypothesis that the blood pressure of Women is the same as the blood pressure of Men (ignoring which treatment groups these individuals belonged to).
So far, this has described a "main effects only" ANOVA model, and would not include an interaction term. An interaction term would be included in a model if the effect of one factor (treatment) depends on the effect of a second factor (sex). In the scenario above, an example of an interaction effect may be that the treatment increases blood pressure in men (compared to men given the placebo), while it decreases the blood pressure in women (compared to women given the placebo). In other words, the effect of treatment (first main effect) depends on the sex (second main effect) of the individual. In this situation, you would want to include an interaction term, and would select the "full model".
Also note that if one or more combination of effects are missing values completely, the full model is unavailable, and Prism will fit a main effects only ANOVA model. Using the example above, if no values were obtained for "Men receiving the placebo" (or any other individual group), Prism would only be able to fit an main effects only ANOVA model.
Assume sphericity?
With two-way repeated measures ANOVA, choose whether to assume sphericity. If you do not assume sphericity, Prism uses the the Greenhouse-Geisser correction and calculates epsilon.
The assumption of sphericity states that the variance of the differences between treatment A and B equals the variance of the difference between A and C, which equals the variance of the differences between A and D, which equals the variance of the differences between B and D... (Or, when repeated measures are stacked in subcolumns, that the variance of the differences between treatment 1 and 2 equals the variance of the difference between 1 and 3...) Like all statistical assumptions, this assumption pertains to the populations from which the data were sampled, and not just to these particular data sets.
Note that if the factor with repeated measures has only two levels, then there is no reason to be concerned about violations of sphericity. For example if each subject is measured before and after a treatment, and there are four different treatments, there would be no need to worry about sphericity, since the repeated measures factor only has two levels (before and after). If you ask for the Greenhouse-Geisser correction with only two levels of the repeated measures factor, the results will be identical to what they would have been if you hadn't chosen that option and the reported value of epsilon will be 1.0000000.