Features and functionality described on this page are available with our new Pro and Enterprise plans. Learn More... |
There are numerous tables of information that can optionally be reported as part of hierarchical clustering results.
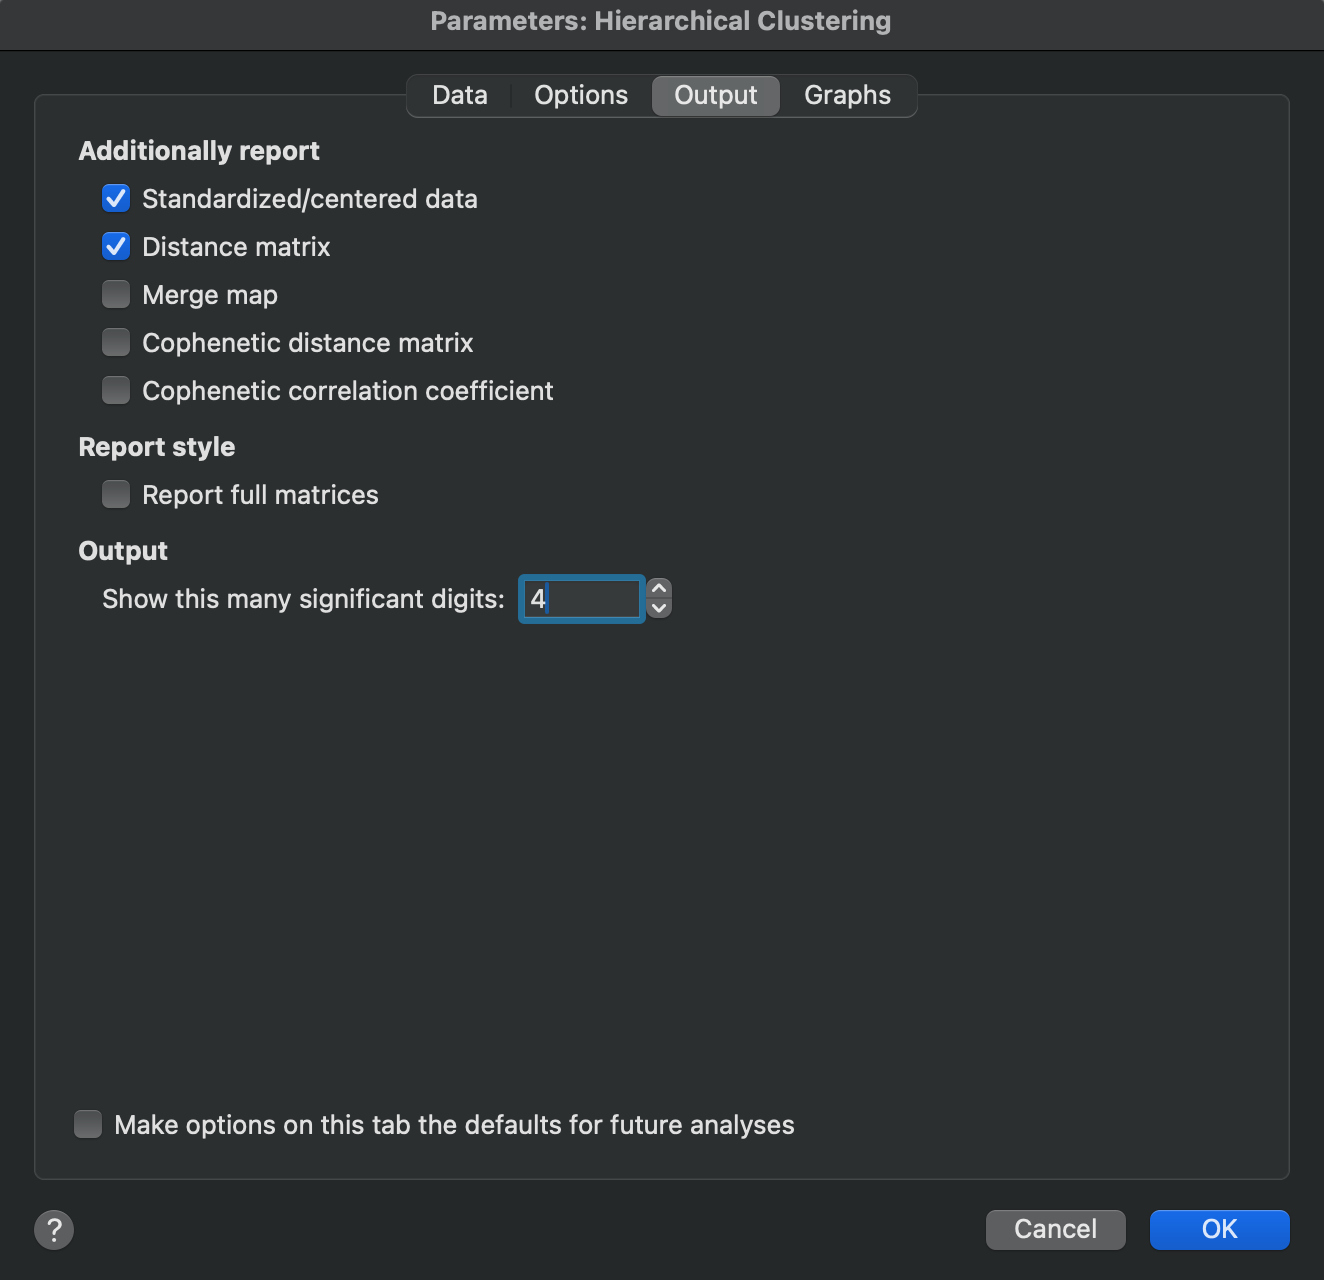
The options on this tab allow you to specify which (if any) of these tables you would like to have reported. These outputs include:
•Standardized/centered data - this table of values is the transformed input data based on selections made in the scaling method section of the Options tab of the analysis. Note that if you choose no scaling (“none”) for both rows and columns, the option to report this table will be disabled
•Distance matrix - this is a table that reports the raw distance between any two observations/objects in the input data. The distance value reported in this table will depend on the distance method selected on the Options tab of the analysis
•Merge map - this table provides the details of the merging process that is shown visually on the dendrogram. Each row represents a merging step, and the table consists of four columns:
oThe “Merge Order” column represents the order that observations/clusters were merged together
oNode 1 is the first observation or cluster that is being merged at that step
oNode 2 is the second observation or cluster that is being merged at that step
oCohpenetic distance is the “height” (represented on the Y axis of the dendrogram) that the two observations or clusters are merged
Note that if a cluster is listed in the Node 1 or Node 2 column, the cluster number refers to the value in the “Merge Order” column. For example:
o“Cluster 1” is listed in the Node 1 column of row 4, and “Cluster 2” is listed in the Node 2 column of row 4
oCluster 1 refers to the cluster that was created when the observations on row 1 were merged
oCluster 2 refers to the cluster that was created when the observations on row 2 were merged
oThe new cluster that results from combining Cluster 1 and Cluster 2 on row 4 can later be referenced as Cluster 4
•Cophenetic distance matrix - the cophenetic distance between two objects is the distance (or height on the dendrogram) between the two largest clusters that contain these objects individually at the point when they are merged into a single cluster that contains both objects. Thus, the cophenetic distance matrix allows you to determine the height at which any two objects are first merged into a single cluster on the dendrogram.
•Cophenetic correlation coefficient - this is a single value reported on the tabular results of the analysis output. This value is a measure of “how well” the dendrogram created by the clustering analysis represents the true distances between each object in the original data. This value is calculated by comparing the values of the distance matrix (itself dependent on the distance method selected) and the cophenetic distance matrix, which can each be reported as part of the output of this analysis. Note that in order to calculate a cophenetic correlation coefficient, there must be three or more objects/observations being clustered
Additional options on this tab include:
•The ability to report full or half matrices (the lower left half) of results
•The option to specify how many significant digits to use when reporting the results of this analysis