Features and functionality described on this page are available with our new Pro and Enterprise plans. Learn More... |
There are three very important options that must be considered when performing a hierarchical clustering analysis:
1.How to normalize or scale the data
2.What distance metric to use
3.What linkage method to use
This page discusses the options available for these three aspects of the analysis, as well as options for defining clusters from the analysis.
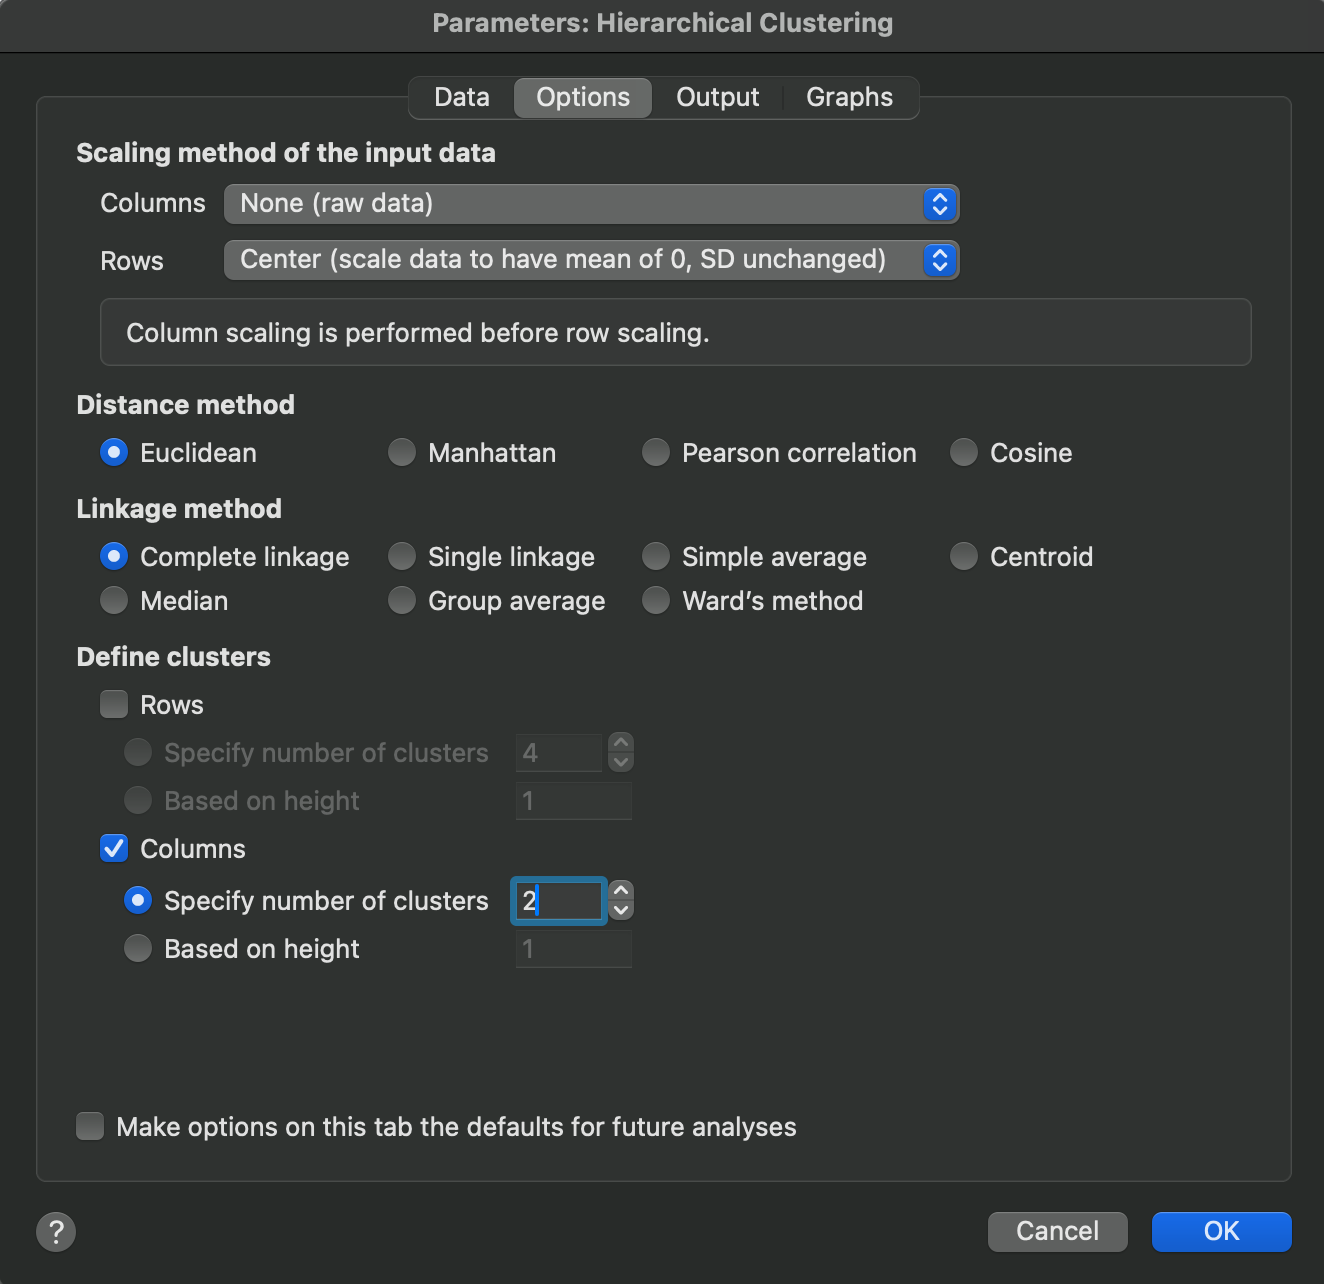
Scaling method of the input data
These options instruct Prism how the input data should be transformed prior to conducting the clustering analysis. Just as clustering can be performed on rows or columns (or both), scaling can be performed on rows or columns. Note however, that scaling will be applied on columns (if selected) prior to performing scaling on rows.
There are three options for scaling within rows and columns:
1.None - don’t transform the data at all and use the raw data
2.Center - transform the data so that it has a mean of zero, but the standard deviation is unchanged. If columns are centered, the column mean is subtracted from each value in that column. If rows are centered, the row mean is subtracted from each value in that row
3.Standardize - transform the data so that it has a mean of zero and standard deviation of one. If columns are standardized, the column mean is subtracted from each value, and this difference is divided by the column standard deviation. If rows are standardized, the row mean is subtracted from each value, and the difference is divided by the row standard deviation
Standardization is often used when dealing with variables on vastly different scales to ensure that one variable doesn’t add more “weight” to the analysis than another. However, it’s worth repeating that any scaling specified for the columns will be applied before applying any scaling specified for the rows. Why is this important? It’s common when clustering rows to scale columns, and when clustering columns to scale rows. However, if you choose to cluster by both rows and columns, you may (logically) also want to apply scaling to both of these dimensions of the data. The problem occurs if you use standardization of the data, because if you first standardize within columns and then standardize within rows, you will end up with different values than if you first standardize within rows and then standardize within columns.
If standardization is required for both rows and columns, consider performing separate analyses on the data.
Note that this issue is less critical if centering is needed for both rows and columns, as it does not matter in which order the rows and columns are centered. The resulting scaled data will be the same in both cases.
Distance method
Clustering methods work by determining the distance between objects (observations or clusters) and then grouping the “closest” objects together into a cluster. However, there are multiple different ways to define the distance between two objects. These options allow you to specify which distance method you would like to use for this analysis.
Linkage method
When performing clustering analyses, the distance between objects (observations or clusters) are determined in order to group the “closest” objects together in a cluster. However, when determining the distance of a cluster to another cluster, there are multiple different ways to define which “point” to use in each cluster to use to calculate the distance between them. These are called linkage methods, and these options allow you to specify which linkage method you would like to use for this analysis.
Define clusters
After (or while) performing a clustering analysis, it’s often desired to specify how many clusters there are in the data. This cluster definition can then be used to customize the visual output from the analysis. For hierarchical clustering, this often means adding color (or other visual properties) to the dendrogram to represent which branches of the dendrogram belong to the same large cluster. There are a couple of different ways that this can be done for hierarchical clustering:
1.Specify the number of clusters manually. This simply allows you to provide an integer value that will be used to segment the data into that many clusters. This may be helpful if you know (or suspect) that there are inherent groupings within the data. Various graphs (such as the elbow plot, silhouette plot, and gap statistic plot) can also help to determine an “optimal” number of clusters
2.Specify a cut height. This method largely depends on visual inspection of the dendrogram created for a hierarchical clustering analysis. A common approach is to identify large distances between merge points in the dendrogram which may represent natural separations between clusters in the data. Wherever the cut height is defined, all observations that are connected below that cut height represent a cluster.
Depending on whether you’re performing clustering on rows or columns, you will have the ability to specify how to define the final cluster output for rows or columns separately.