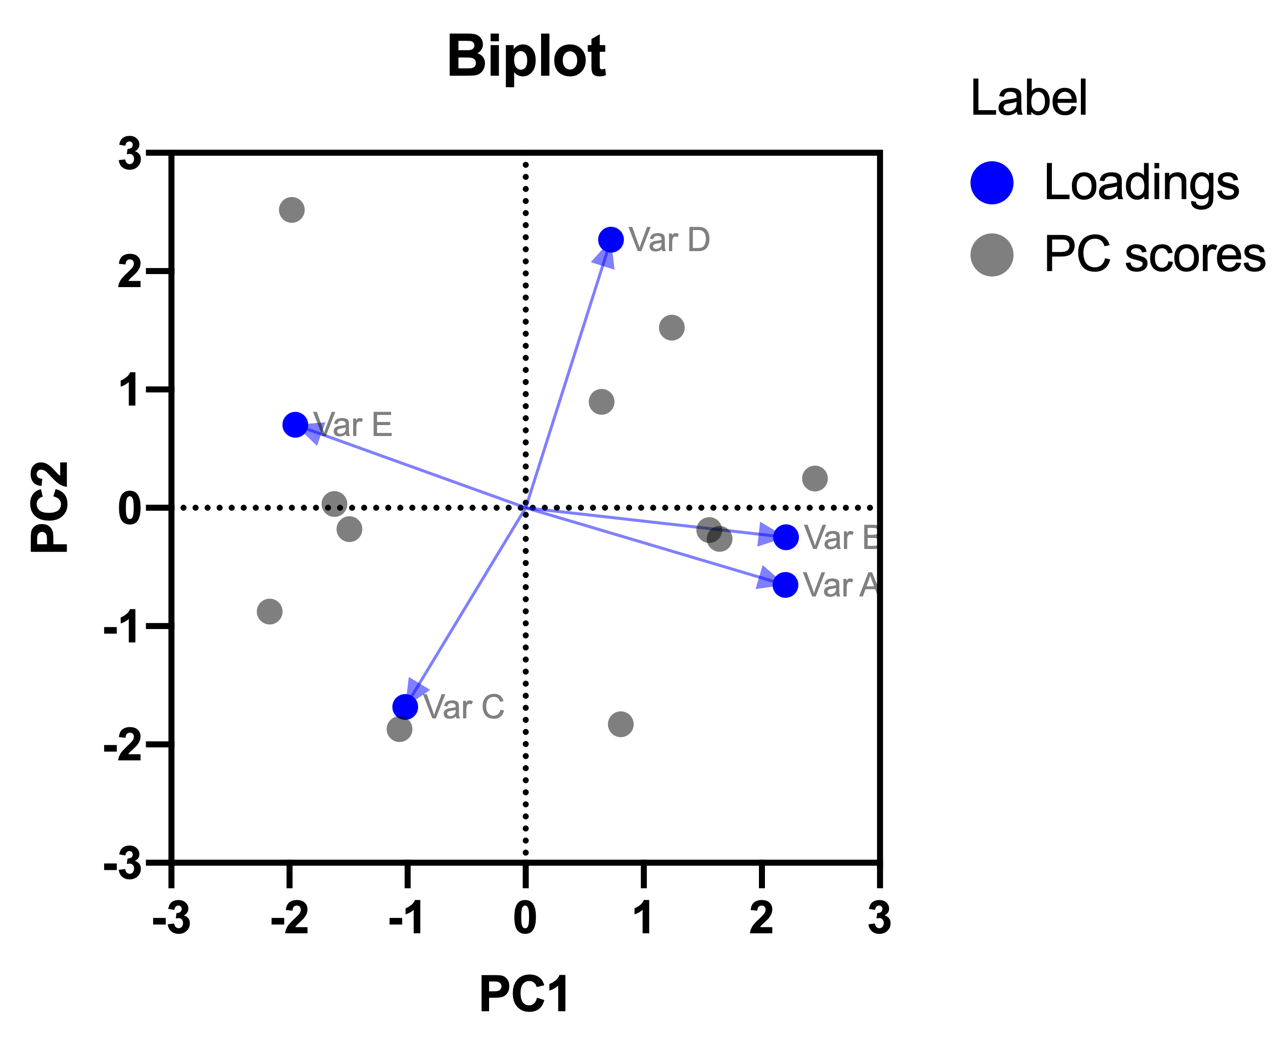
The biplot is a graph that contains the information presented in both the Loadings plot and the PC scores plot at the same time. Some prefer to have this information presented on the same graph, but with lots of data points, this graph can become exceedingly hard to interpret.
Note that for this plot, the axis scale is the same as for the PC scores plot. The points representing the PC scores will be located in the same position on both graphs. However, the loadings vectors have been scaled to fit within this new axis range (the loadings are scaled to 90% of the PC scores). This means that the angles of the vectors can be interpreted in the same way as in the loadings plot, but this is not true for the coordinates of these vectors.