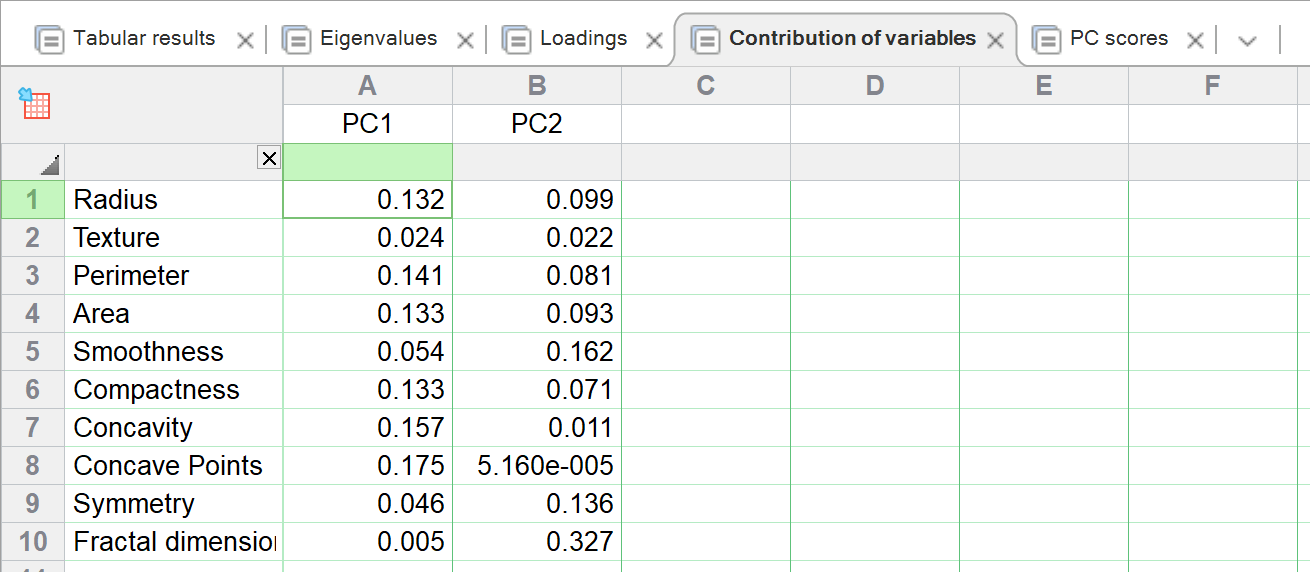
The contribution matrix of variables indicates which variables ‘contribute’ overall to the calculation of the PCs. Each row represents one variable, and each column represents one PC. Only PCs that were selected by the chosen selection method are displayed in this table. The values in a single column represent the fraction of total variance explained by that PC that each variable contributes. As such, these values sum to 1.0 (100% of the variance explained by the PC). Numerically, these values are the square of the corresponding values in the eigenvectors table.
In the example below, Compactness, Concavity and Concave Points all contribute about the same amount to PC1.