In an XY table, every point is defined by both an X and a Y value.
Analyses performed with XY data
•Nonlinear regression (curve fit)
•Linear regression
•Fit Spline/LOWESS
•Smooth, Differentiate or Integrate Curve
•Area Under Curve
•Deming (Model II) Linear regression
•Correlation matrix
•Correlation XY
•Interpolate a Standard Curve
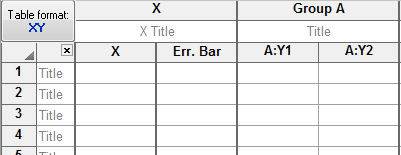
Example of an XY table
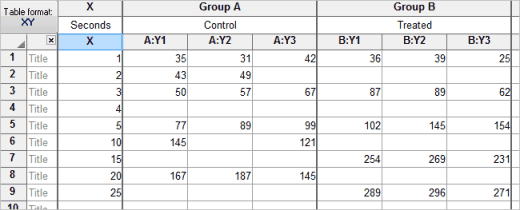
▪The first optional column is for row titles to label individual subjects or samples.
▪The next column ("X") is for X value. There is only one X column per table. If you choose to enter X error values, then there will be two subcolumns (one for X, one for the error value).
▪Each remaining column ("A", "B", ...) defines a treatment group.
▪Subcolumns are for replicates in a treatment group. Prism uses these to calculate error bars.
▪Blank cells represent missing values.
▪Blue italics values are excluded from graphs and analyses.
▪An XY data table can contain 256 data set columns and as many as 256 sub-columns.
▪XY tables can be configured to enter dates or times into the X column, instead of numbers. Choose when you create table.
Error bars
Prism will compute and graph error bars from replicate values placed in side by side subcolumns as shown (triplicate values) in the table above. Specify the number of subcolumns when you create a new XY table.
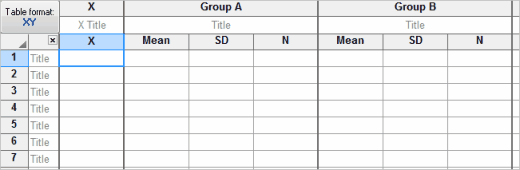
You can also choose to create subcolumns formatted for entry of error values computed elsewhere.
Prism can also plot horizontal X error bars. You must enter X error values directly; Prism cannot compute them. You can only enter one value for X errors, so X error bars are always symmetrical.
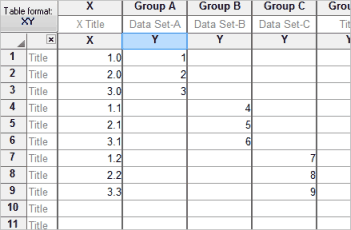
Entering multiple sets of data that don't share X values
Each data table has a single column for X and up to 104 sets of Y values. What should you do if you have different X values for each set of Y values? There are two ways to solve this problem.
The best approach is to stagger the data entry. You don't have to start entering data in the first row. This example shows three data sets with different X values.
An alternative approach is to enter each data set on a different table. The disadvantage with this method is that you lose some analysis choices. You must enter all the data sets on one table in order for Prism to compare linear regression lines, to compare best-fit values from nonlinear regression, and to compare survival curves. Another minor disadvantage is that Prism will automatically make a different graph for each table. However, you can delete the unneeded graphs and include data from all the data tables on a single graph.
Entering error values for X error bars
If you choose to enter X error values, the table will include a subcolumn for that purpose. You can only enter one error value for each X. Prism doesn't know if it is a SE or SD or something else. It just plots what you enter. You cannot enter two error values to create asymmetric X error bars. The X error values never enter into any calculations.
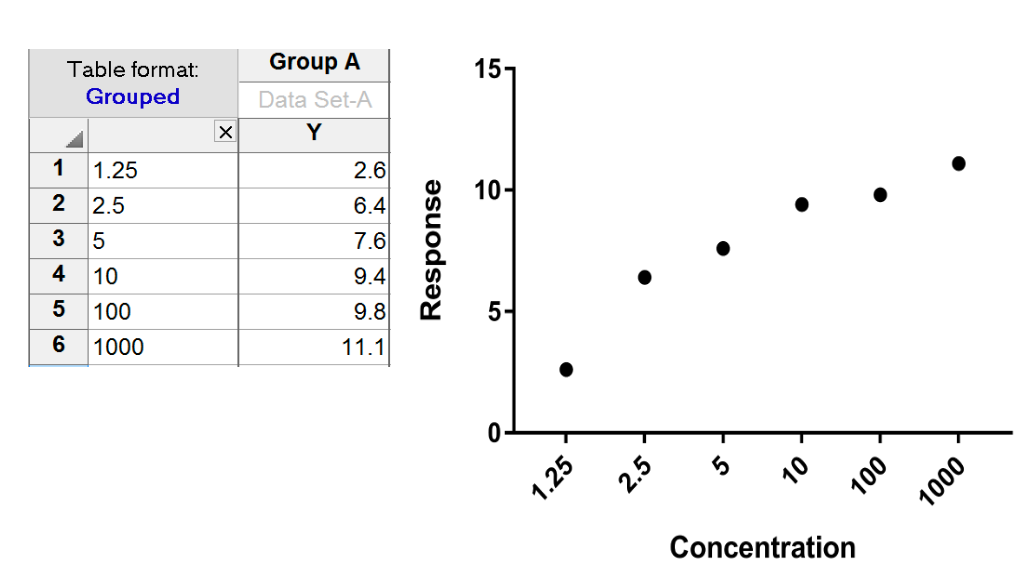
What happens if you enter X values into the row title column of a Grouped (or XY) table?
Possible point of confusion. A Grouped table has a column for entry of row titles. Prism sees these as titles or labels, even if you enter numbers in every row. The table below if a Grouped table with no X column. Note that there is no heading "X" and that the labels (numbers) entered in that column are left justified (X values would be right justified). Also note that the values are equally spread across the X axis. Prism doesn't "know" these labels are numbers, so doesn't use the value as a X coordinate.