Features and functionality described on this page are available with Prism Enterprise. |
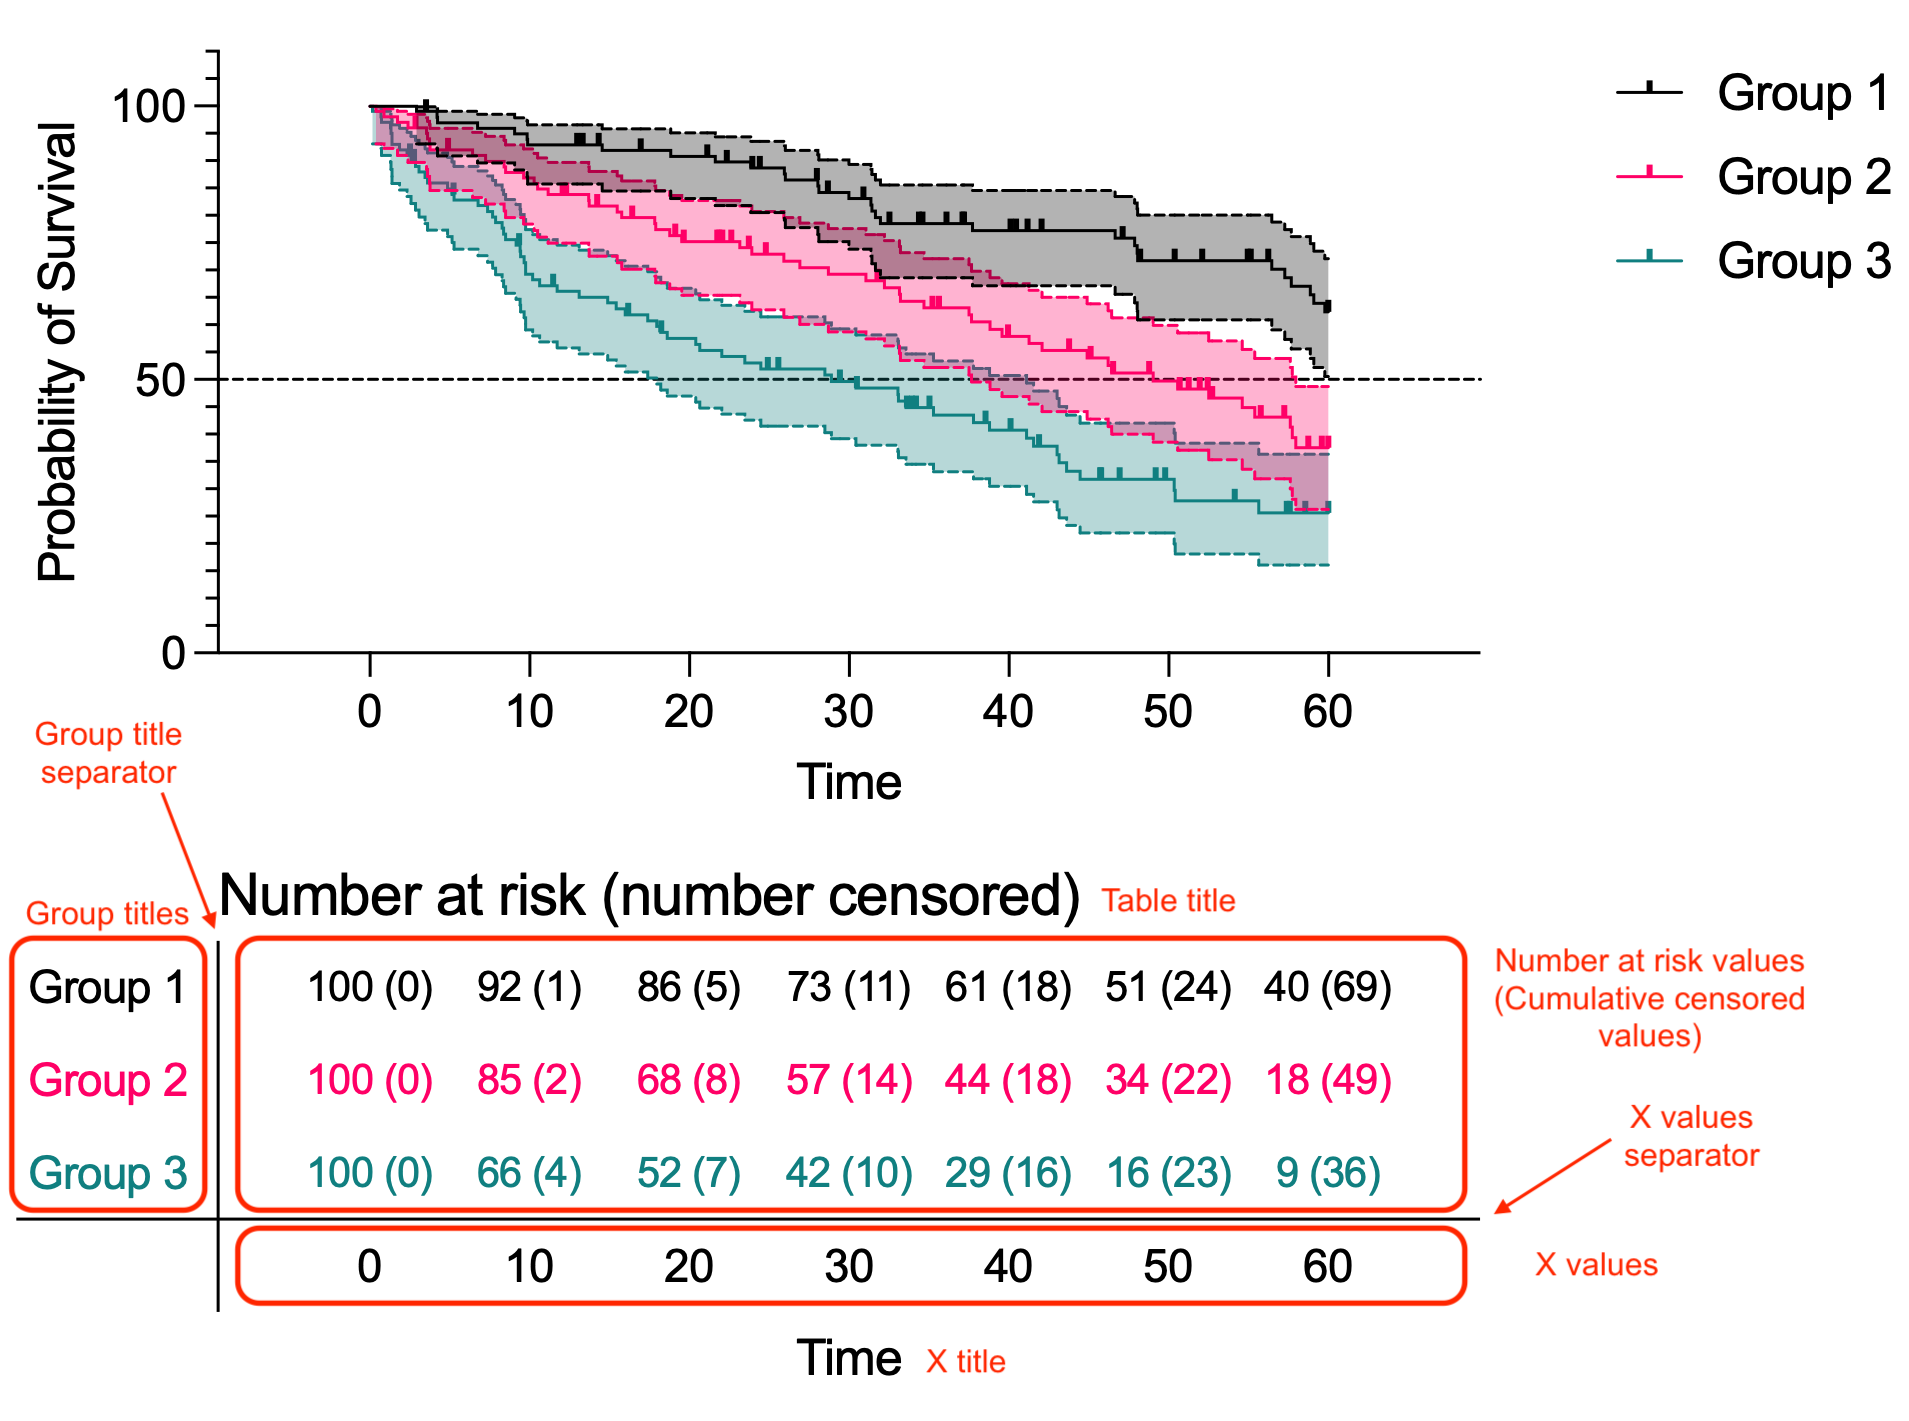
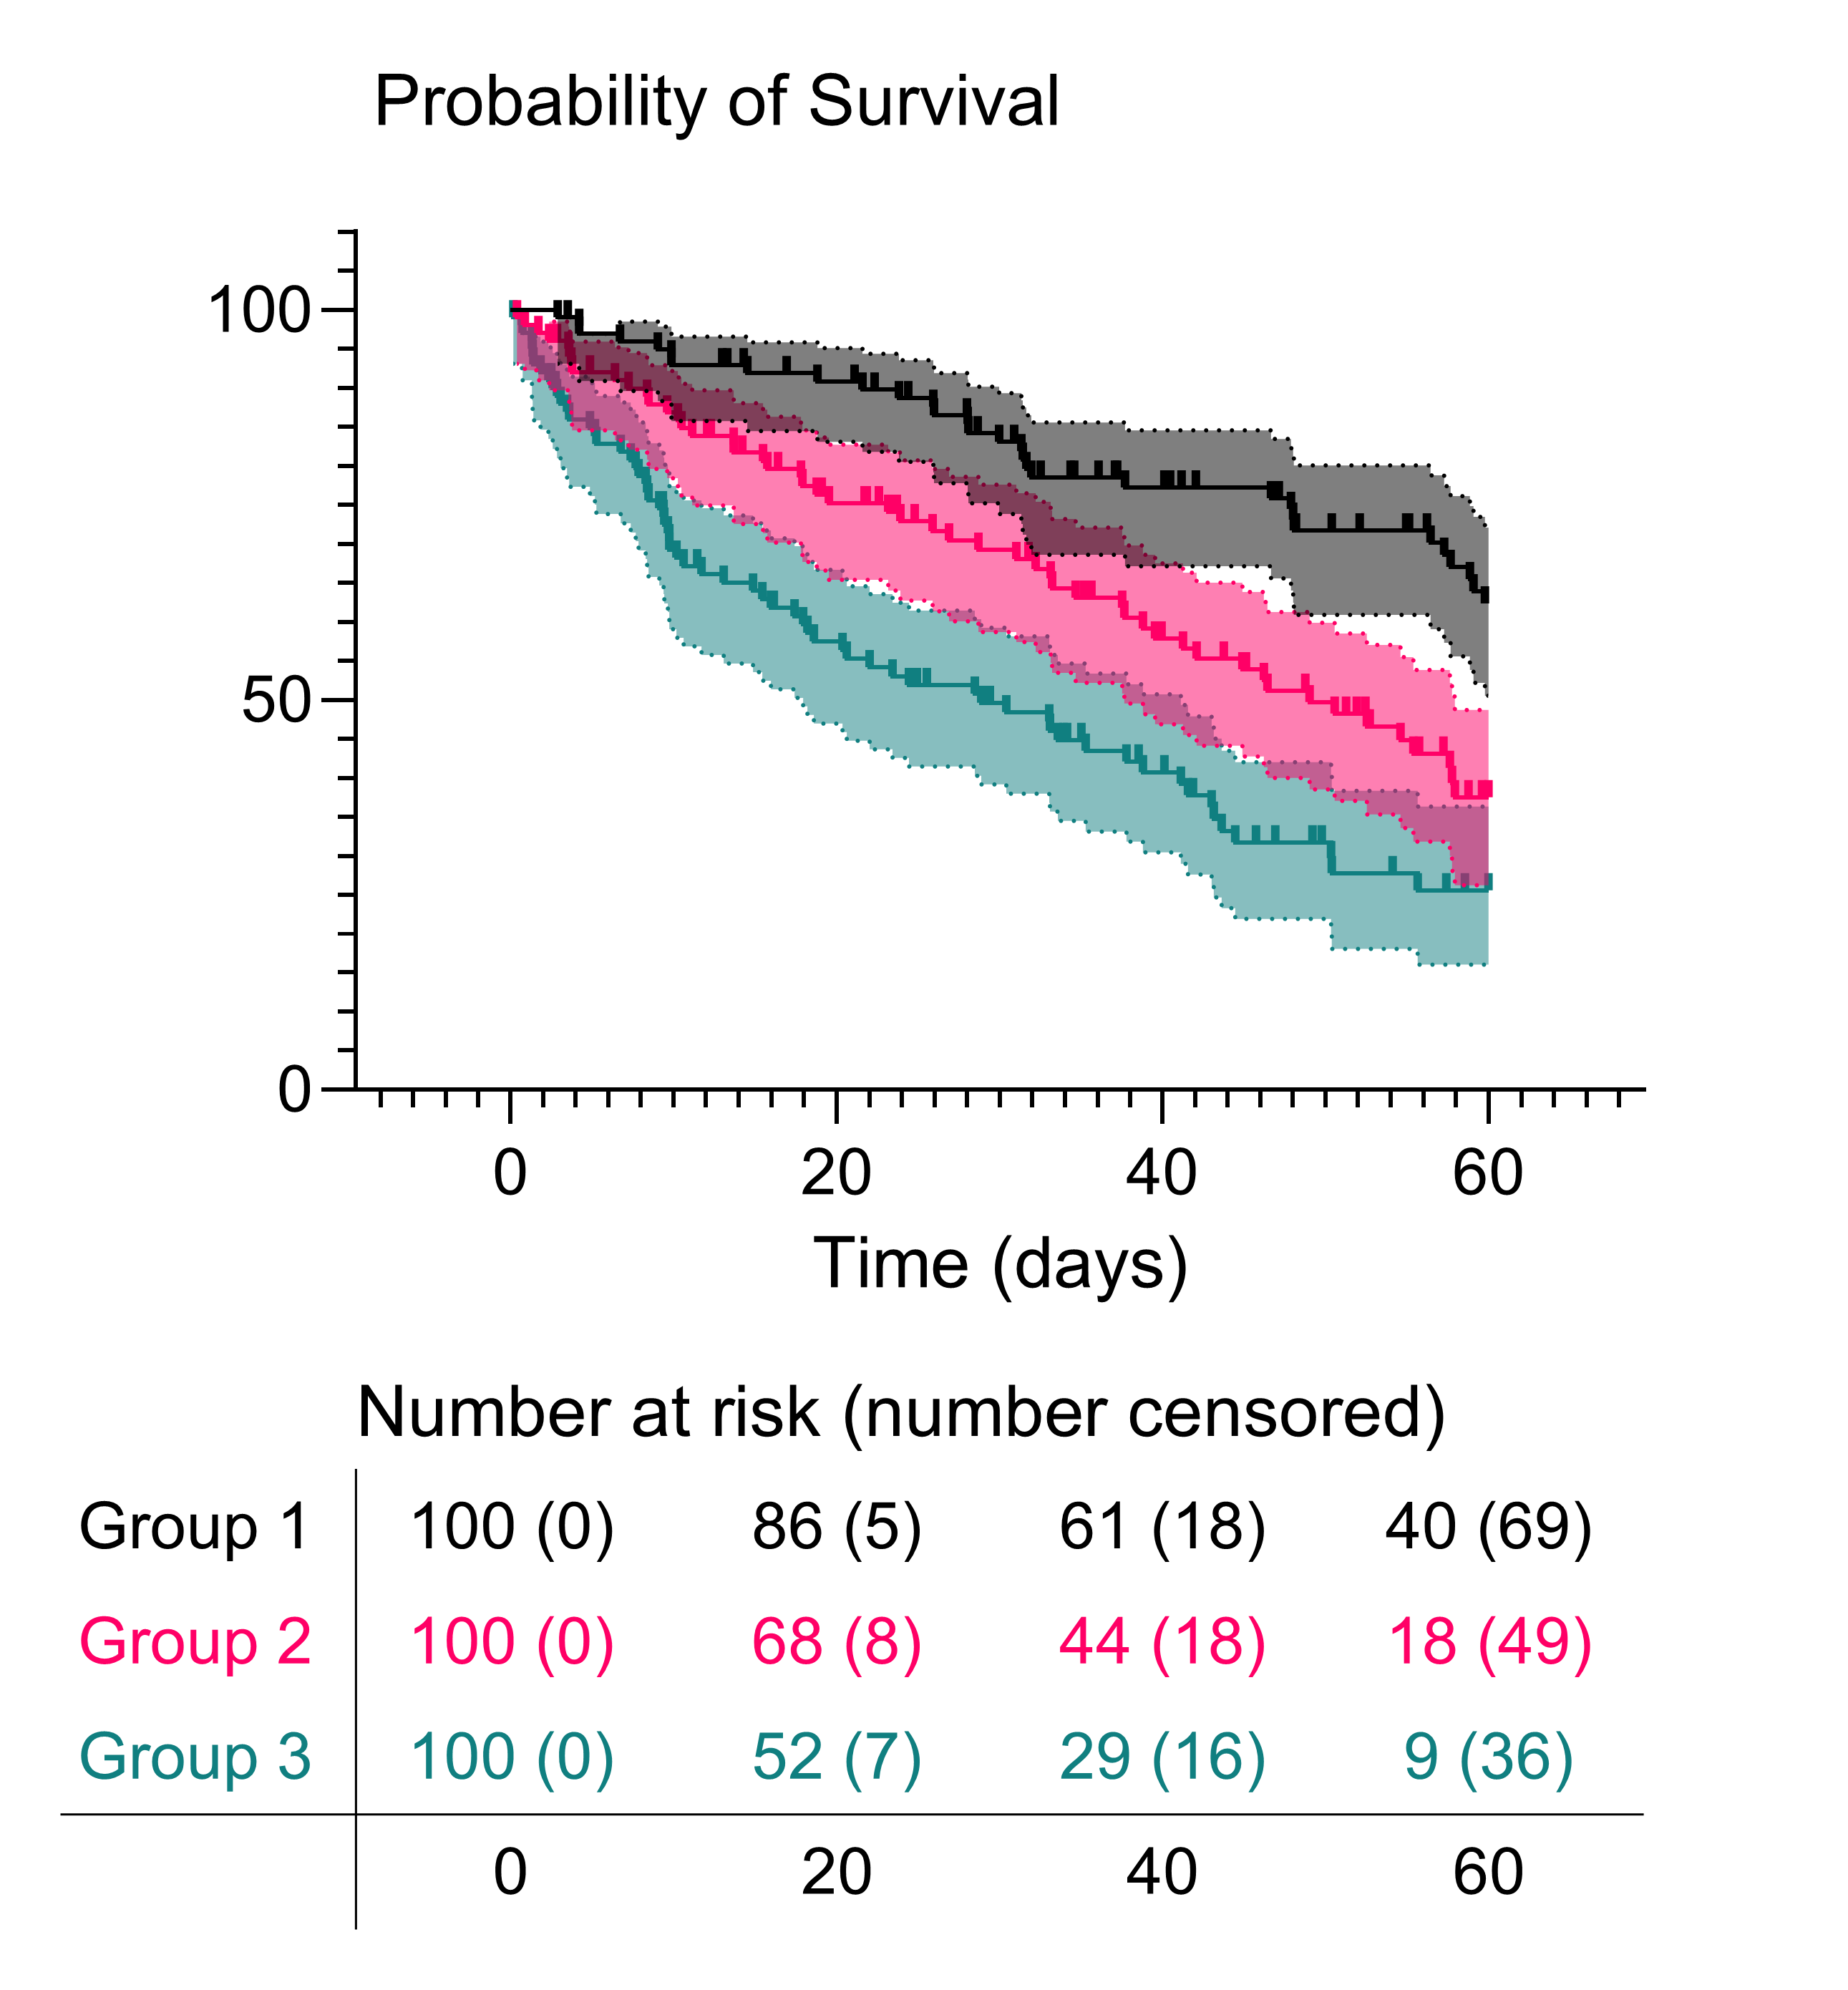
When performing Kaplan-Meier survival analysis, Prism will automatically generate a graph of the resulting survival curves. Starting in Prism version 10.5, Prism will also automatically add a dynamic number at risk table to accompany this graph. The Prism Statistics Guide provides detailed explanations about what each component of the table represents, while the remainder of this page provides details on how this table can be visually customized.
Adding or removing the number at risk table
To add a number at risk table to an existing graph of survival data, simply click the Number at Risk Table button in the Draw section of the primary toolbar. Alternatively, open the Insert menu and select "Number at Risk Table...". To remove an existing number at risk table (or placeholder when the feature is restricted), simply click on the table and press the delete key.
It's also possible to specify whether a number at risk table should be added to the graph at the level of the Kaplan-Meier survival analysis parameters. Simply open the analysis parameters dialog, and check the option "Show Number at Risk table below the graph"
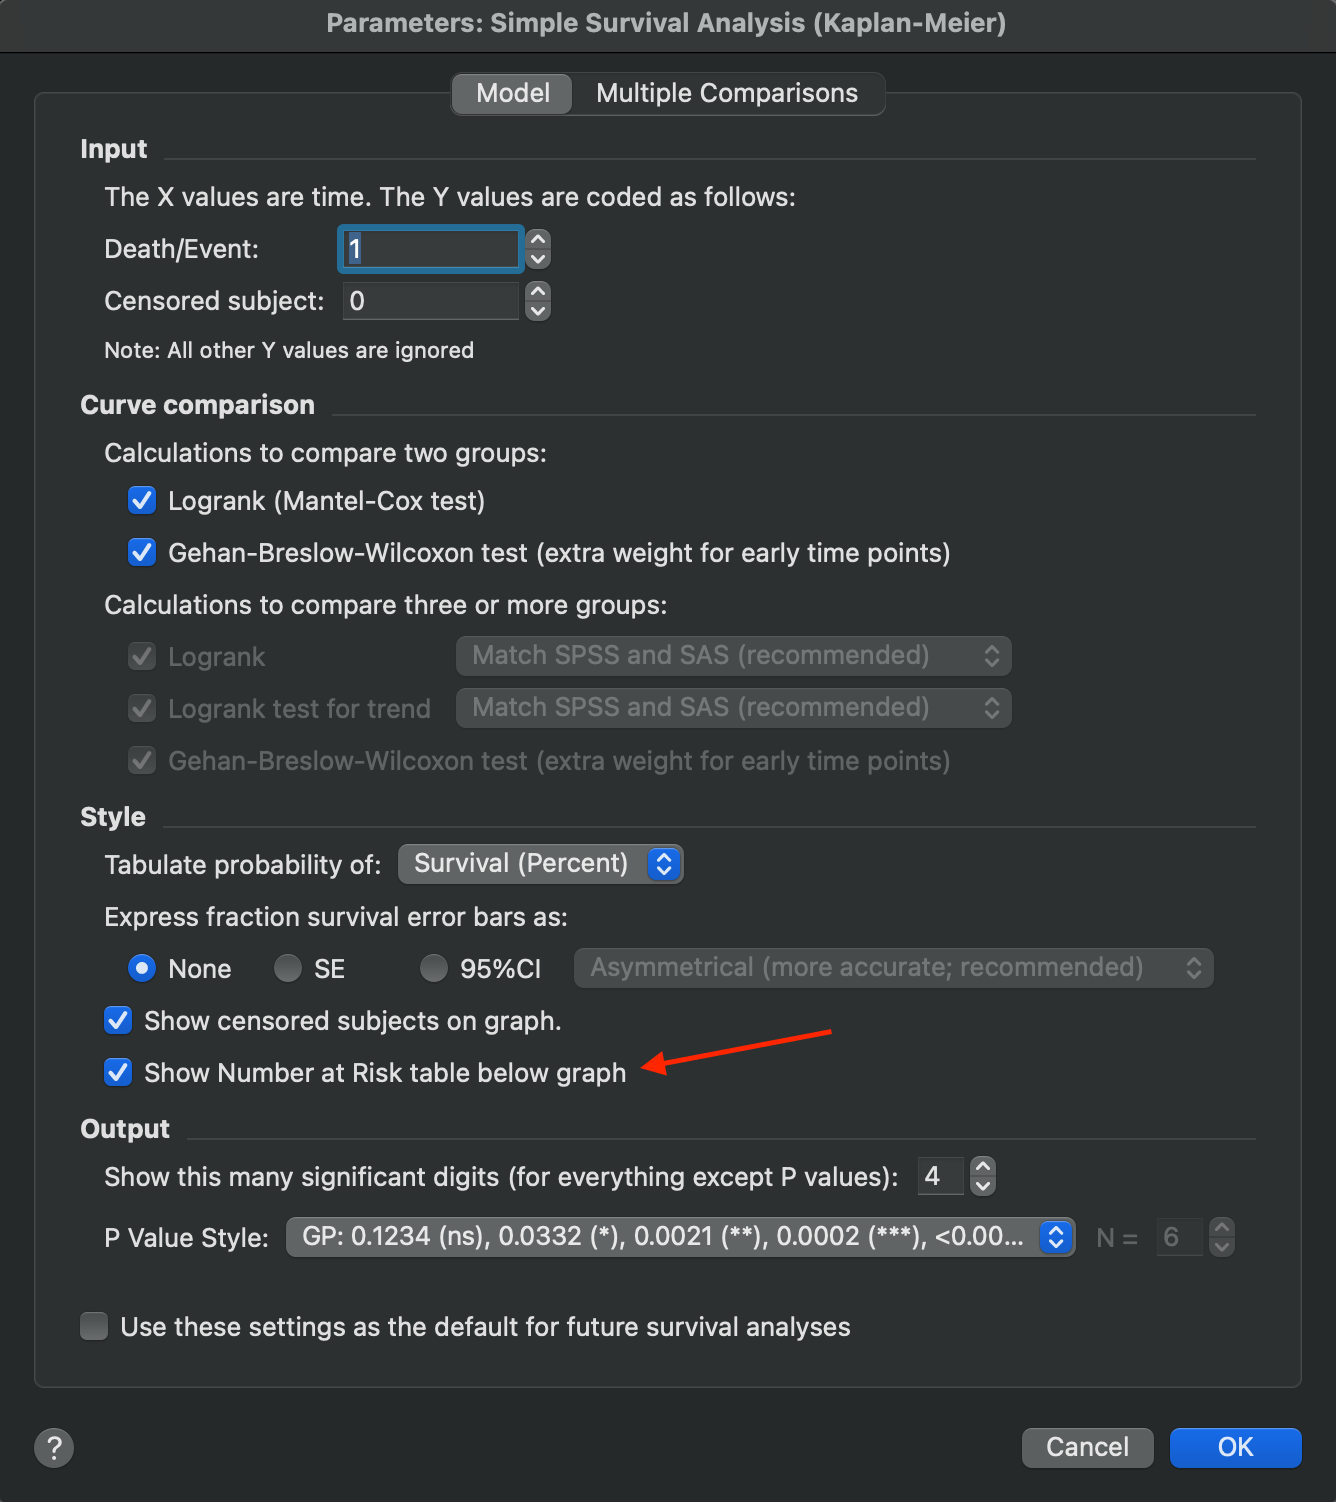
Table customization
The Format Number at Risk Table dialog
For an existing number at risk table, either double click on the table or click on the number at risk toolbar button to open the Format Number at Risk table dialog.
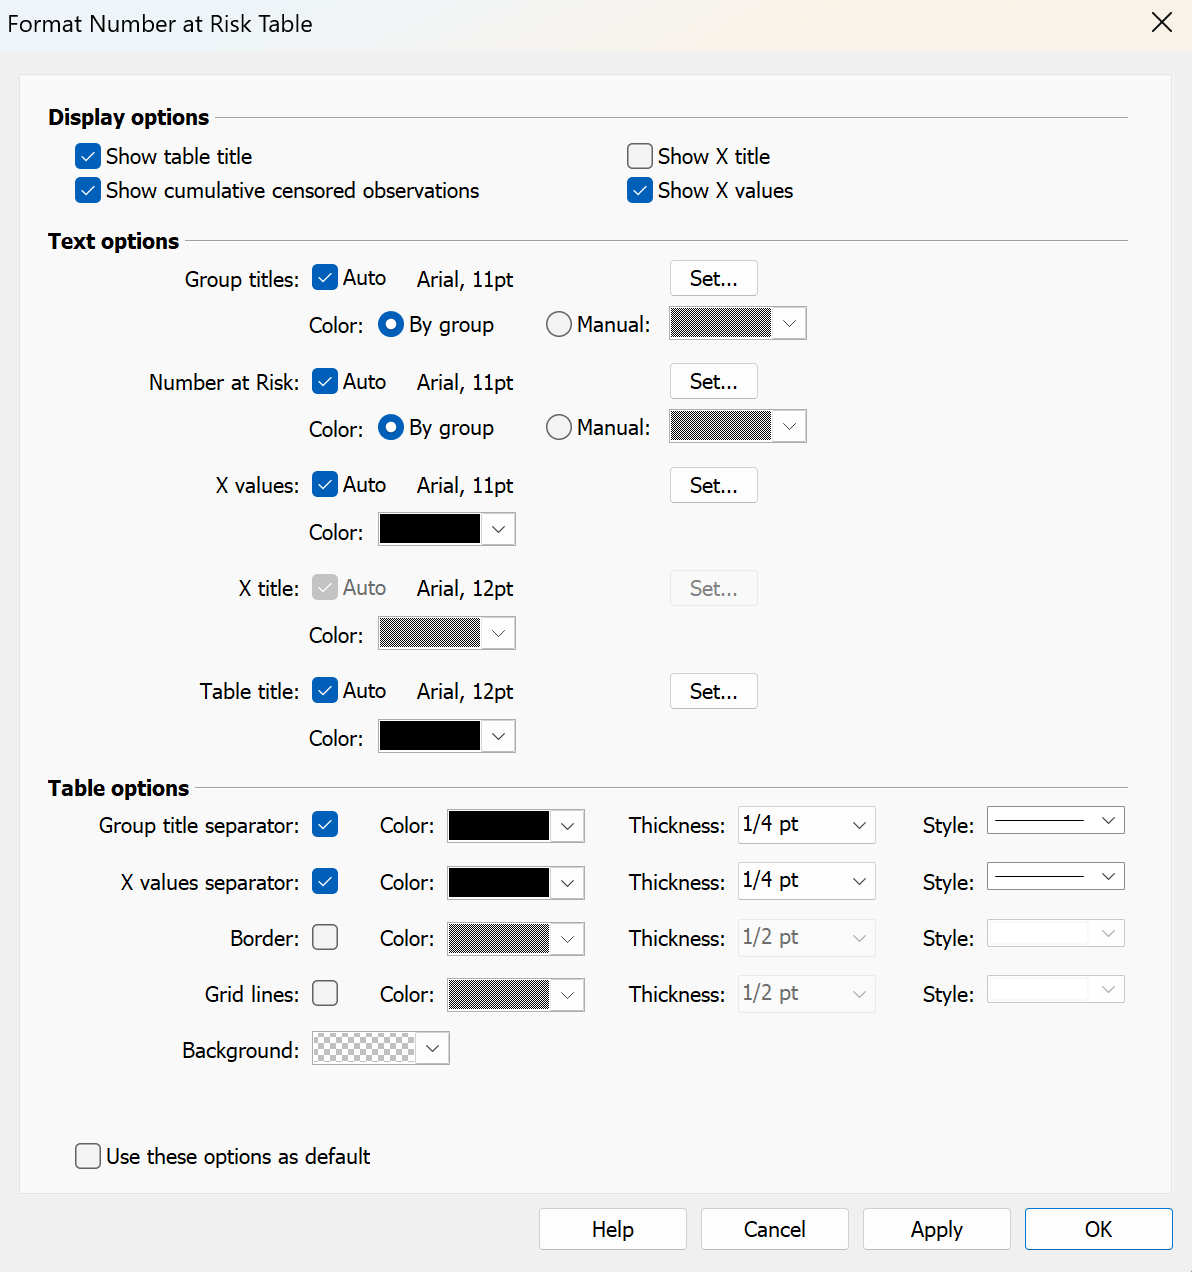
This dialog exposes all of the customization options available for the number at risk table, and the following sections will describe how each of these various options work.
Display options
Choose to either show or hide the following table components:
•Table title
•X title
•X values
•Cumulative censored observations for each time point
Text options
There are five separate sets of text that can be customized on the number at risk table. By default, the text size and style for each of these is set to "Auto". These auto settings ensure that the formatting of these table texts match the style of related text components on the survival graph. The five text objects on the number at risk table and their graph counterparts are:
•Number at risk (and cumulative censored) values - linked to the X axis labels to determine automatic text size and style
•Group titles - also linked to the X axis labels to determine automatic text size and style and to ensure that by default the group titles have a text settings as their corresponding number at risk (and cumulative censored) values
•X values - also linked to the X axis labels as these represent the same values in both places
•X title - linked to the X axis title of the graph
•Table title - linked to the graph title
Un-checking the "Auto" box for any of these will allow you to specify separate font sizes and styles for each of these text objects. If at any point you want to re-synchronize the appearance of these text objects, simply re-check the "Auto" box.
The color of these text objects can also be specified. The table title, X title, and X values can be specified manually with any custom color. The group titles and number at risk (and cumulative censored) values have an additional option to specify their text color "By group". This option allows Prism to automatically apply the same color to these text objects as the corresponding line color for this data on the graph. This means that you can change the color scheme of your graph and the number at risk table colors will update automatically!
Table options
These options primarily involve specifying whether or not you would like to have the various table/cell borders shown and their individual line thicknesses and styles. By default, Prism enables the group title separator
Quick reference guide