Double-click on the graph origin to open the Frame and Origin tab of the Format Axes dialog.
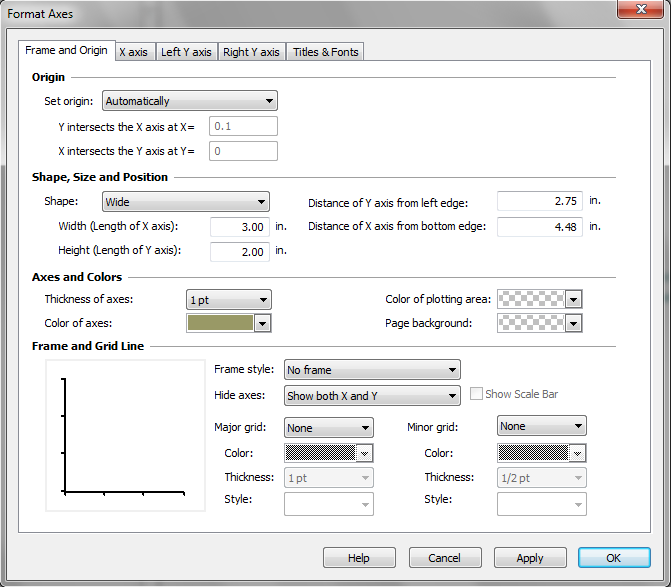
Use this dialog to set the origin of your graph and to format the color and shape of the axes or surrounding frame.
|
|
|
|
|


Notes:
•To change the gap of an offset axis, click and drag the end of the axis.
•To draw a box around a graph, including titles and numbering, use the drawing tool. Or wait until you assign a graph to a layout, and choose the border on the second tab of that dialog.
•To change the color or thickness of one axis. In rare cases, you may want to change the color or thickness of one axis and not the other(s). Or you may want to make one axis white (or whatever your page background color is) to make it essentially invisible. To do this, select the axis, drop the Change menu and choose Selected Object. Then change the color or thickness in the Format Object dialog.