If you've already entered data onto an empty data table, it is too late to clone, too late to duplicate a family, and too late to open a template -- at least without copy and pasting data.
Prism provides a great tool to solve this problem: the Wand (Wizard to ANalyze Data). Use it to analyze (and graph) the new table just like you already analyzed (and graphed) an existing table.
Follow these steps:
1.Start from the data table (with data) you wish to analyze (and graph). Or select multiple data tables in the gallery.
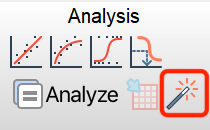
2.Click the Wand button on the toolbar, to bring up the Analyze Data dialog.
3.Choose the existing data table (in the current project) you want to use as an example.
4.At the bottom of the dialog, optionally enter the prefix you wish to appear in front of the new sheet names (there's a small note to be aware of when adding prefixes to default sheet names that you may want to read below)
That's it. The new table (where you started from) will be graphed and analyzed the same as the example table.
Notes about the Wand feature:
When was the Wand feature introduced
The name Wand was new to Prism 6. This functionality existed before this, but was called Applying a Method, and was harder to find and use.
Can Wand be used with stored methods?
You don't have to only rely on analyses within the Prism file you're working with. You can also choose to use the Wand to apply a stored method file. To save a method file, go to the data table that has been analyzed and graphed, drop the File menu and select Save Special… Save Method. Where is it saved? To apply that saved method file, click the Analyze button, and then choose Use Saved Method at the top left of the Analyze Data dialog.
The Wand button looks a lot like the Magic button for graphs...
The same icon is used for both the Magic and Wand features. Magic (Make Graphs Consistent) changes the appearance of selected graphs so they look like an example graph. You can only use Magic when you start from a graph, or a set of graphs selected in the gallery. The Wand analyzes and graphs a new table the way you have already analyzed and graphed another table. You can only use the Wand when you start from a data table with data, or a set of selected tables.
Are there any downsides to adding prefixes to sheets created with the Wand feature?
When using the Wand feature, it can be helpful to include a prefix (such as an asterisk) in the names of the sheets that are created to keep track of where these sheets came from. However, by adding a prefix to these sheets Prism will no longer view these sheet names as being default names. This is rarely ever an issue, but it means that Prism will not change the sheet name in situations where it would generally change the default sheet name.