Prism offers a wide range of different analyses designed to be performed from a variety of different sources including data tables, graphs, and even some results sheets. In addition, Prism offers a number of powerful analysis tools that don't require data input but that will instead generate simulated data that you can work with.
Step 1. Select an analysis
To begin an analysis (or to use Prism's simulate tool to generate some data), start from any data table or graph. There are two ways to access Prism's analysis library:
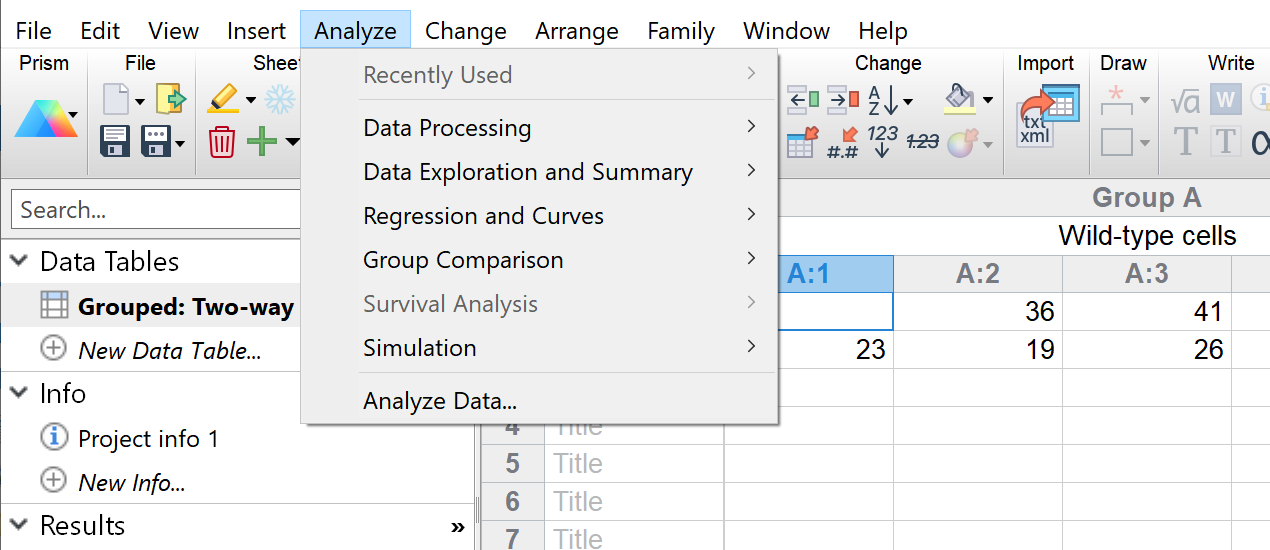
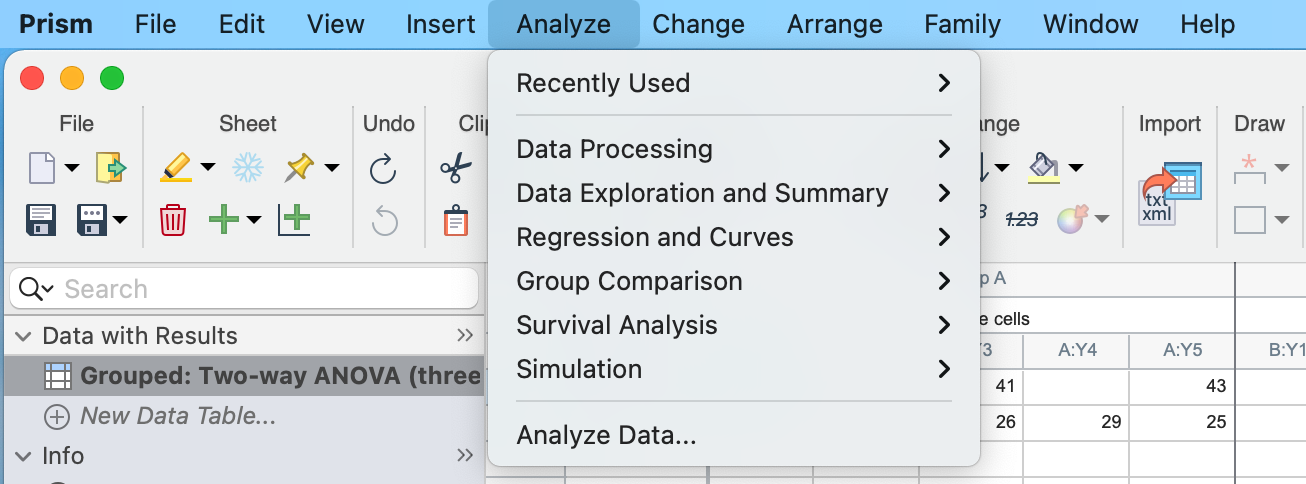
1.The Analyze menu which groups Prism's analyses by the objective of the analysis. There are six groups of analyses (including simulation), and selecting any available analysis will take you to the Analyze Data dialog with the specified analysis pre-selected. Here you'll be able to indicate which data sets (columns) you would like to analyze (see The Analyze Data Dialog section below)
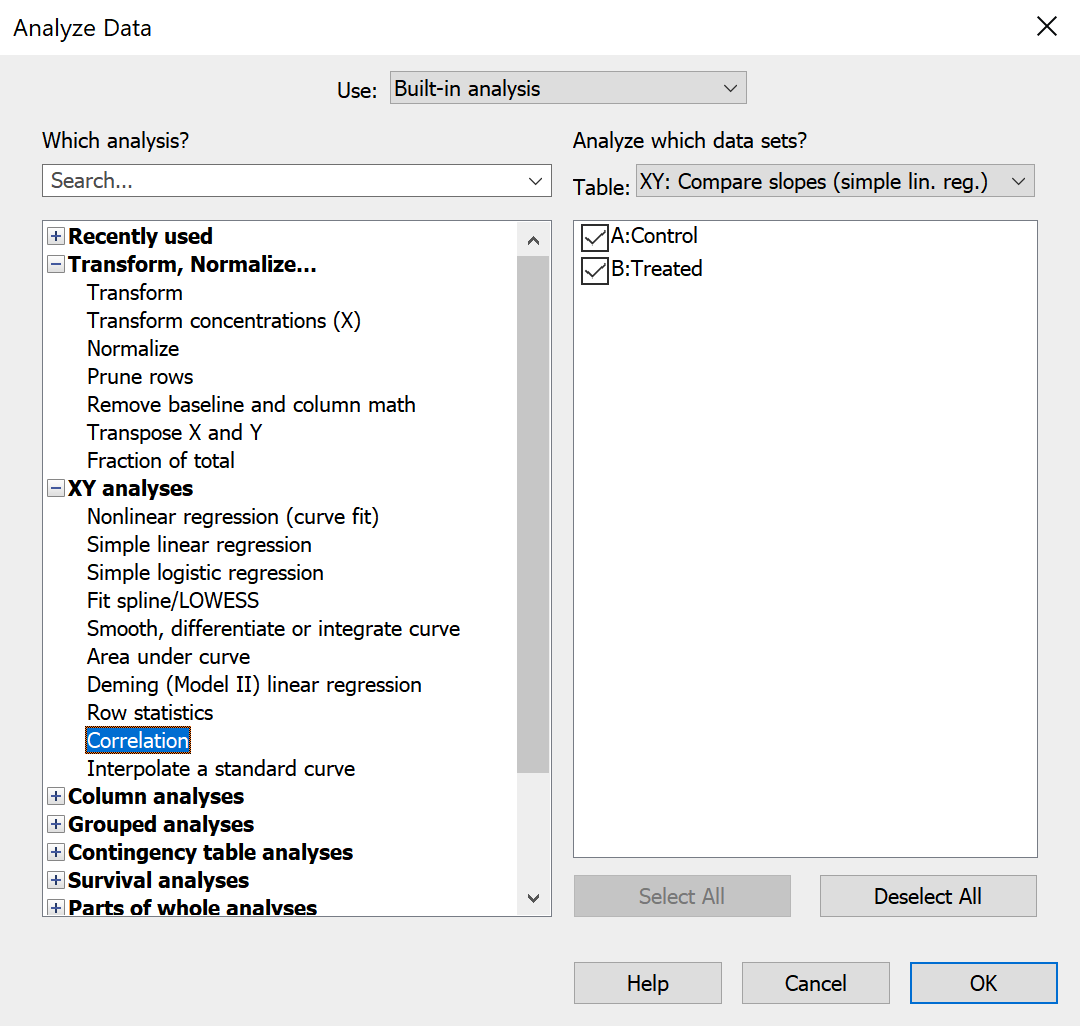
2.The Analyze button in the Prism toolbar which will take you directly to the Analyze Data dialog. In this Analyze Data dialog, Prism's analyses are grouped primarily by the type of data table that they're generally used with (note that many analyses can be performed on data from more than one type of data table).
Each of these approaches are discussed below.
A third method to initialize an analysis is by using the buttons located in the Analysis section of the Prism toolbar. Instead of accessing the analysis library, these buttons each take you directly to the parameters of their specific analysis. Additionally, the analysis buttons available in this section depend on the type of data table (or graph or results sheet) that you currently have selected.
The Analyze Menu
The Analyze Menu is found at the top of the Prism window (on Windows) or in the Menu bar (on Mac) between the Insert and Change menus (this menu was introduced in Prism 9.1, and so will not be present in earlier versions of the software). There are six groups of analyses in the analysis menu. These groups (and the analyses listed within each) are discussed on this page.
Analyze Menu on Windows
Analyze Menu on Mac
Upon selecting the analysis you'd like to perform, you'll be taken to the Analyze Data dialog described below.
The Analyze Data dialog
The Analyze Data dialog can be opened by either clicking the Analyze button in the Toolbar, or by opening the Analyze menu and selecting "Analyze Data...". There is no need to first select a range of data to analyze. In fact, Prism completely ignores any selection you made before opening the Analyze Data dialog.

After clicking this button, the analyze dialog will appear. At the top of this dialog, a dropdown menu will allow you to select between running an analysis from Prism's built-in library, or using a saved Method. Most of the time, you'll want to make sure "Built-in analysis" is selected. The analyses that Prism offers are listed in the left panel of the dialog, and are organized by the type of data table that they're generally used with. Above this panel, a search bar allows you to simply type in the name (or part of the name) of the analysis that you want to use, and Prism will show a filtered set of analyses that match the name entered.
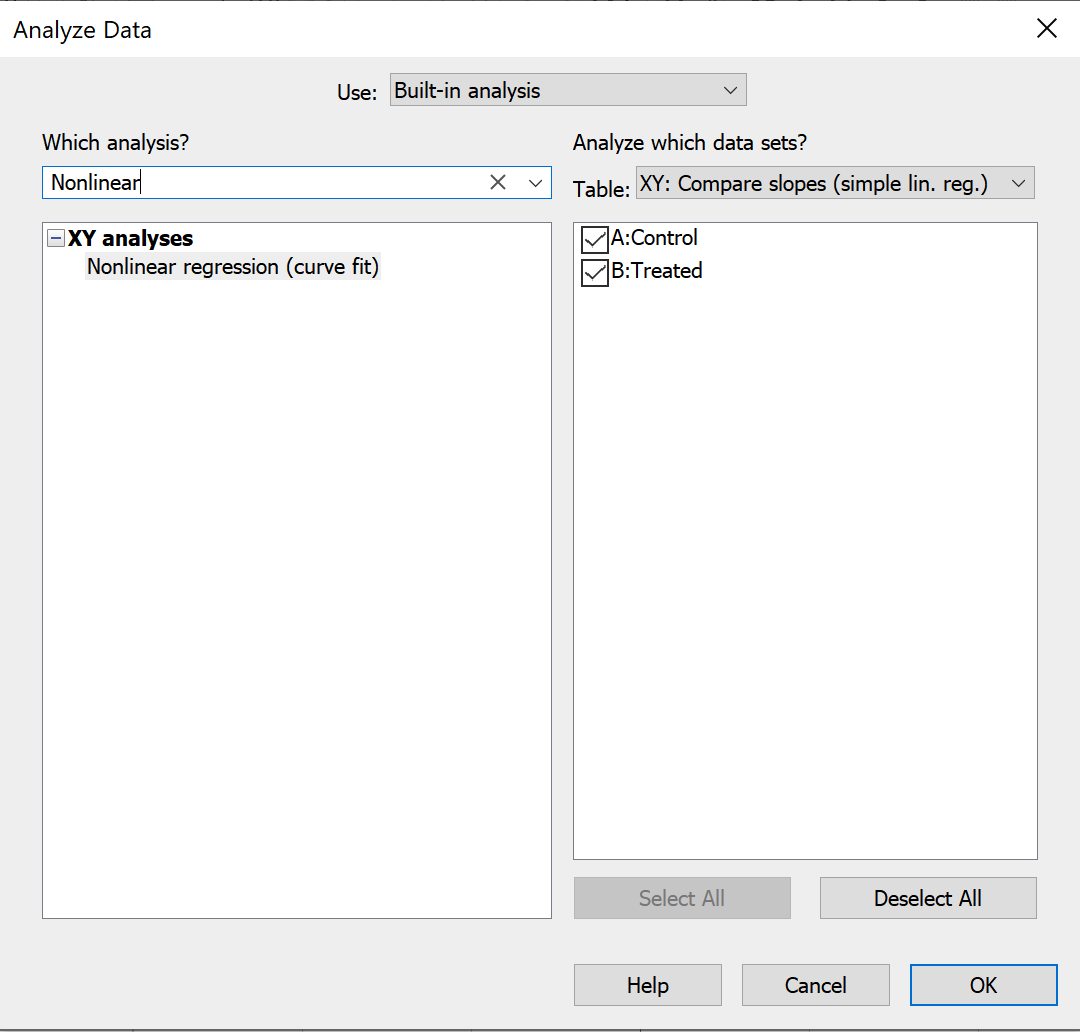
Above: (Left) Analyze menu showing some of the available analyses in Prism's built-in library. (Right) Filtered analysis list using the search term "Nonlinear".
The Analysis toolbar buttons
These shortcuts will not open the Analyze Data dialog, but will instead open the specific parameters dialog for the selected analysis. The analysis buttons available will depend on the sheet that is currently selected in the Navigator. Some examples are given below.
Analysis toolbar buttons for XY data
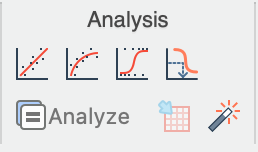
These analysis buttons represent (from left-to-right) simple linear regression, nonlinear regression, simple logistic regression, and interpolate a standard curve
Analysis toolbar buttons for Multiple Variables data
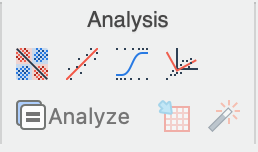
These analysis buttons represent (from left-to-right) correlation matrix, multiple linear regression, multiple logistic regression, and principal component analysis (PCA)
Analysis toolbar buttons for Grouped data
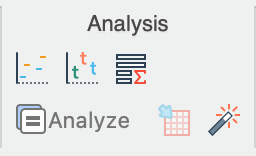
These analysis buttons represent (from left-to-right) two-way ANOVA, multiple t tests (and nonparametric tests), and row statistics
Step 2. Selecting options in the Analyze Data dialog (optional)
The right half lets you choose to only analyze selected data sets. It is typically not possible to choose a subset of rows to analyze -- Prism analyzes them all (an exception to this rule is the "Select and transform" analysis for Multiple Variables data in which a subset of data can be generated by selecting specific rows of the original data set in the analysis parameters dialog).
Step 3. Analysis parameters dialog
Each analysis dialog has its own parameters dialog. Read about individual analyses to learn about the choices.
If you are unsure about an analysis choice, click the Learn button in the dialog to go to the appropriate help topic.

Step 4. View the results
Some results are presented on several analysis tabs. Choose an analysis tab to view .
Step 5. Analysis checklist
Click the Analysis checklist button in the Interpret section of the Prism toolbar to review a list of questions that will help you interpret the results.