Prism offers seven distinct types of data tables. Three of these can be used to create scatter graphs.
XY scatter graphs
With an XY data table, each X value can have several replicates for every data set. When you make your graph, you can choose to show all the replicates on your graph instead of error bars. Start with an XY table if you want to show all your replicates for each X value.
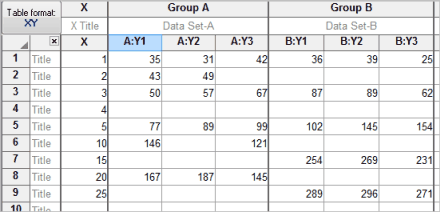
Here is the data table for the graph above.
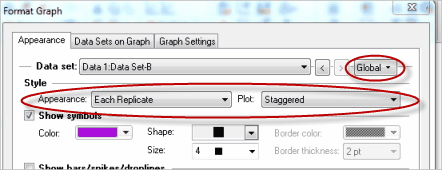
To format an XY graph to show each data point as in the graph above, click on the Format Graph button on the toolbar, select Global to choose all data sets, and choose to Show each Replicate. To show mean and error instead, choose Mean and Error from this drop-down menu instead.
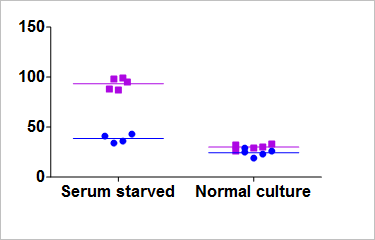
Column scatter graphs
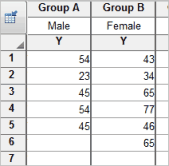
If you want to compare groups and show every data point along with lines for mean and error for each group, start with a column table. All the data values for each group should be entered in a single column.
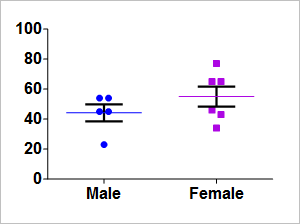
To make the graph above, start with a Column table and enter all the data points for each data set in a column. Prism will create error bars from all the data points in each column.
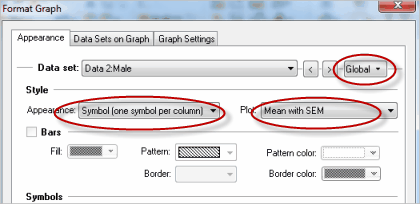
If you instead want a graph that shows only the mean and error for each data set, double click on any data point to open the Format Graph dialog and choose "One symbol per column" and the type of error you want to show.
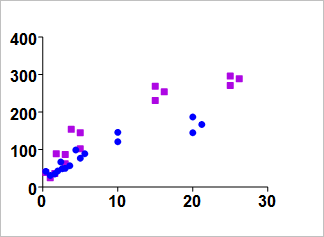
Grouped scatter graphs
If you want to create a scatter plot comparing groups by more than one variable, enter data on a Grouped data table with side by side replicates.
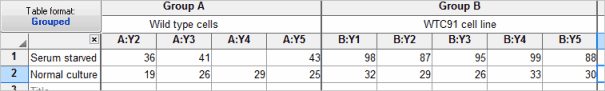
Here are the data plotted as an interleaved graph:

You can also choose to superimpose the groups: