
KNOWLEDGEBASE - ARTICLE #1358
How to view the XY coordinates of confidence or prediction bands fit by noninear regression
Prism can plot a best-fit nonlinear regression curve along with confidence or prediction bands (or both).
Prism 7-8:
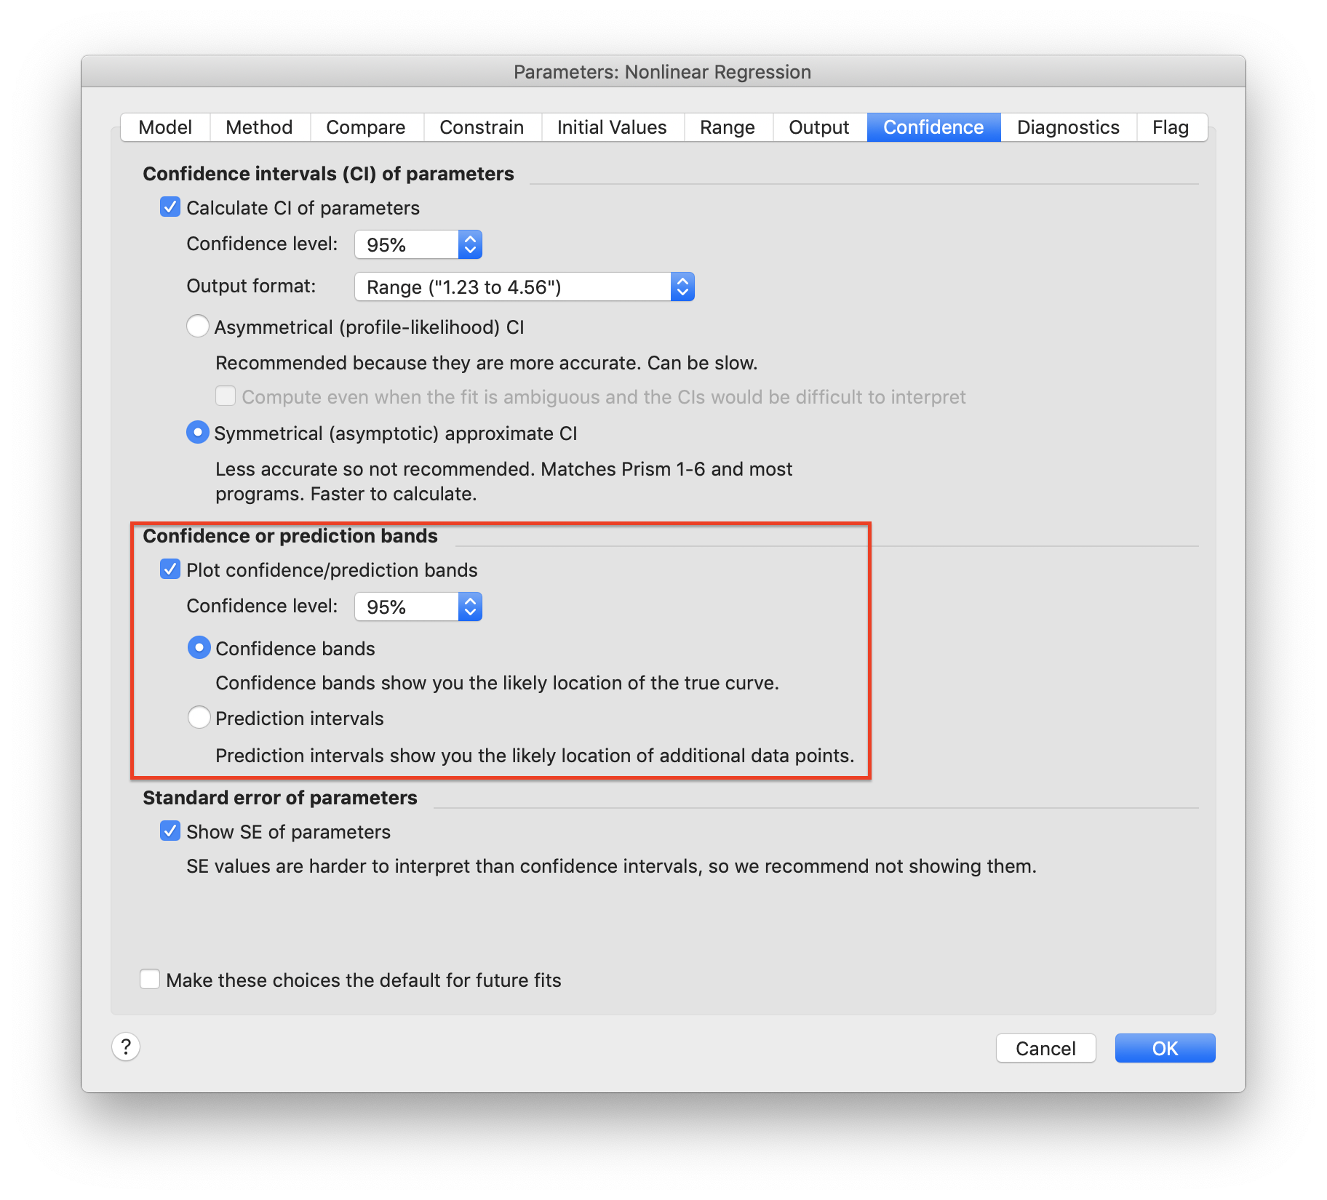
Choose in the Confidence tab of the "Parameters: Nonlinear regression" dialog:
- Go to the Confidence tab and check the option to plot confidence/prediction bands.
- Select the confidence level and choose between Confidence bands and Prediction intervals. Click OK in the dialog.
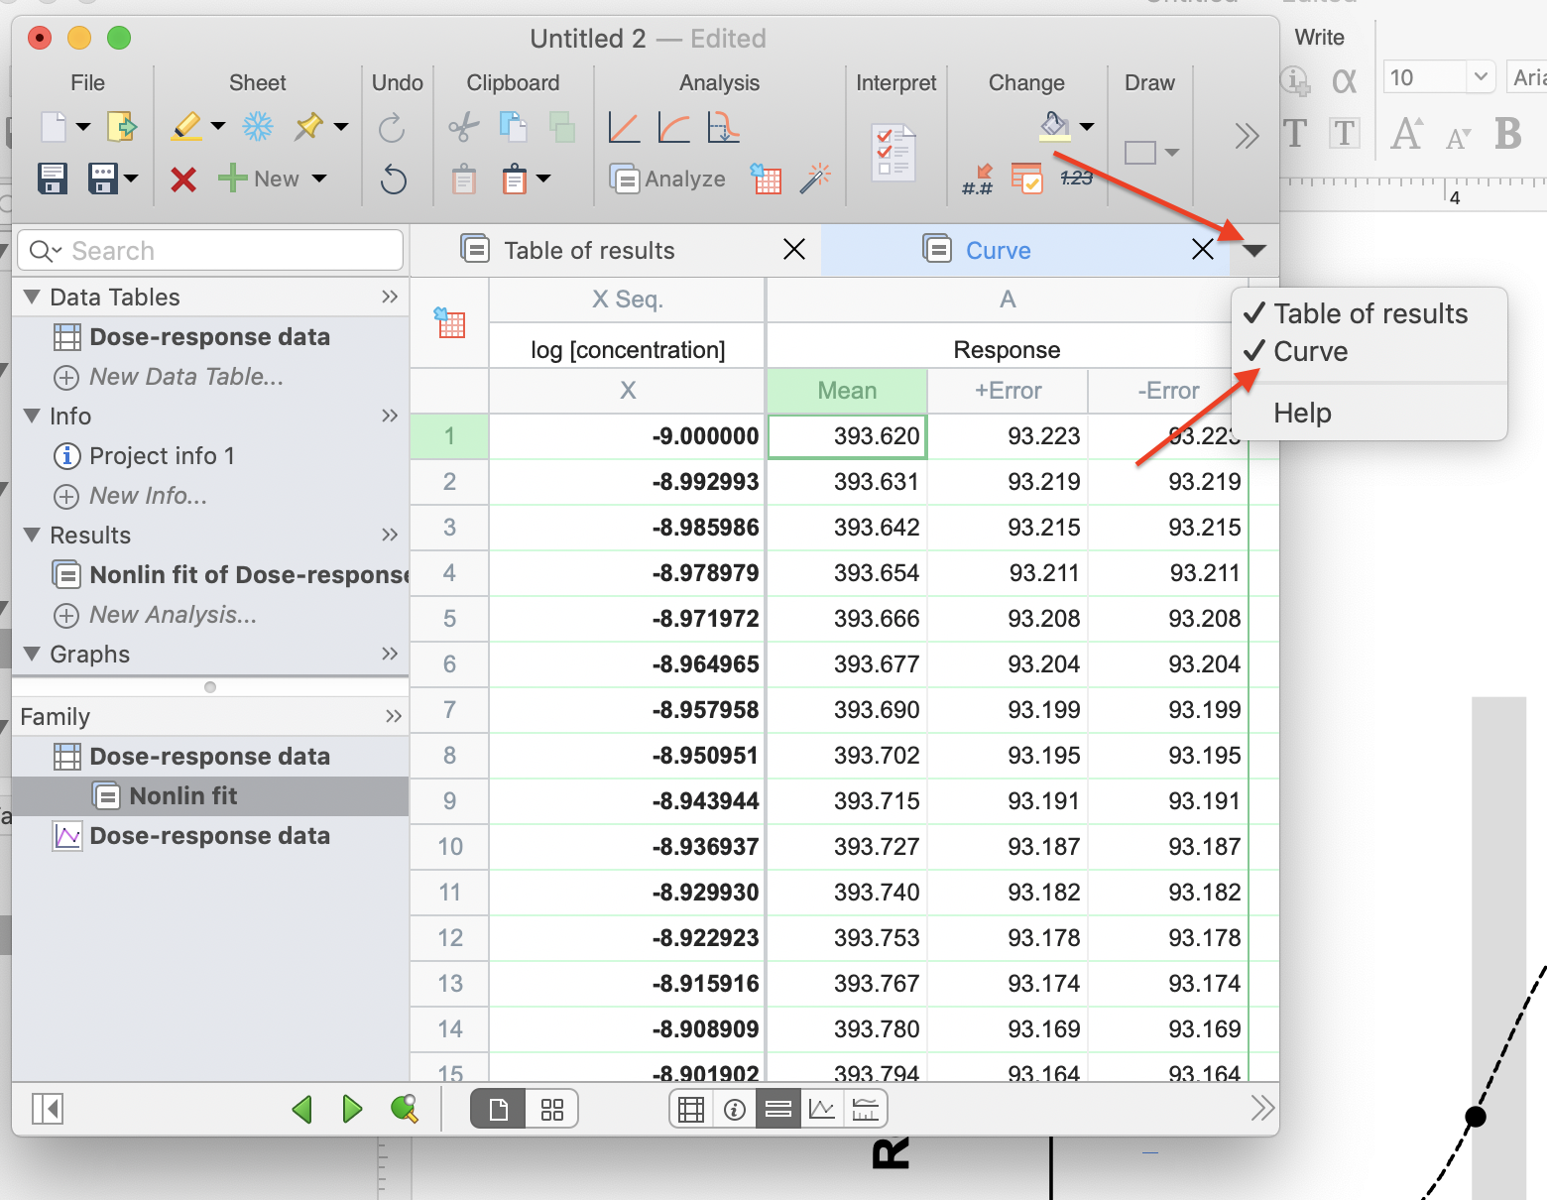
- Switch to the results sheet and click the downwards triangle in the upper-right-hand corner and select 'Curve'.
- When viewing the results, you will see that for each X value there will be y value and the distance the confidence or prediction curve is above and below it.

Prism 5-6:
Choose in the Diagnostics tab of the Nonlinear regression dialog.
Prism can also show you the XY coordinates that define the curve and confidence bands (or prediction bands). But it only shows this table if you ask for it:
- Go to the Diagnostics tab and check the option to plot confidence or prediction bands.
- Go to the Range tab of the nonlinear regression dialog.
- Check the option to create a table of XY coordinates. This table will include the confidence or prediction bands.
- Enter the number of XY pairs you want to define the curve. 150 is a reasonable starting value, but of course, it all depends on why you want these values.
- When viewing the results, expand the results sheet in the navigator and go to the page labeled 'Curve'. For each X value, you'll see the Y value and the distance the confidence or prediction curve is above and below that value.