
-
Prism
FEATURES
Analyze, graph and present your workComprehensive analysis and statisticsElegant graphing and visualizationsShare, view and discuss your projectsLatest product features and releasesPOPULAR USE CASES
- Enterprise
- Resources
- Support
- Pricing
P Value Calculator
Use this calculator to compute a two-tailed P value from any Z score, T score, F statistic, correlation coefficient (R), or chi-square value. Once you have obtained one of these statistics (from a publication or even another program) the P value helps interpret its statistical significance.
Learn more about how to find P value statistics in the description below the calculator.
What is a P value?
P values (or probability values) are used in hypothesis testing to represent the chance that, assuming the null hypothesis is true, you could observe the result in your study or one even more extreme. P values help researchers avoid publication errors, specifically Type I Errors. While still widely used in scientific research, misuse of P values is at the heart of what is referred to as the "replicability crisis".
They are reported as a decimal between 0 and 1, with some threshold (usually 0.05) deemed the significance critical value. This calculator only uses two-tailed P values.
P values are often considered the most widely misinterpreted concepts in all of statistics, often oversimplified to "the probability your outcome was due to chance". Here are a couple examples of correct P value interpretations compared to several incorrect ways to state P value results.
Check out this video on understanding P values for a quick refresher course if you are unsure about P values.
Below you can learn how to find P values for the most common statistical tests.
Performing hypothesis testing? We can help.
Sign up for more information on how to perform hypothesis testing and other common statistical analyses.
How do I interpret P values?
If the P value is less than that critical value, you reject the null hypothesis. If it is equivalent or higher than the critical value, you fail to reject the null hypothesis.
Keep in mind, smaller is "better" when it comes to interpreting P values for significance. The closer to 0 it is, the stronger the evidence that you should reject the null hypothesis.
What is a Z score?
The Z score is a measure of how many standard deviations a data point is away from the mean. Z scores rely on the standard normal distribution (or Gaussian) which has a mean of 0 and a standard deviation of 1. It is primarily used to test for differences between means for large samples.
The most common formula to calculate a Z score involves the observation (X), the hypothesized mean (μ), and hypothesized standard deviation (σ):

Enter any number for Z to calculate the P value from Z score statistics. Entering your Z score as positive or negative will result in the same P value, because this test is two-sided.
What is a T score?
T scores (or T statistics) are used to test the difference between a sample mean and another sample mean or some theoretical value.
They are often confused with Z scores, and with large sample sizes, the two tests converge. While there are plenty of similarities, the key difference is that while z scores standardize and test differences for proportions, T scores are used for testing mean differences from small samples. The basic form of a T statistic formula is:

You can use this page to calculate the P value from T score statistics (and the correct degrees of freedom). Both positive and negative values of T will give the same result, and P values are interpreted similarly for all T tests.
What is an F statistic?
F statistics are most commonly used as part of ANOVA. They are calculated (usually by software) as a ratio of two components of the variance in a study. With ANOVA, they are used to analyze if some potentially predictive factor has an impact on the response variable.
You can use this page to calculate the P value from an F statistic (and the correct degrees of freedom). Only positive values of F are appropriate. Use the ANOVA framework for help with interpreting P values from F statistics.
What is r?
Pearson's r is better known as the correlation coefficient. It quantifies the strength of the correlation between two variables, as well as the direction of the relationship.
R always falls between -1 and 1, with 0 representing no evidence of correlation. A perfectly linear negative relationship would be -1 ("as x goes up, y goes down"), while 1 represents a perfect positive linear relationship ("as x goes up, y also goes up").
The statistical test for correlation uses a null hypothesis that the correlation is 0, which would indicate no correlation, so a P value less than the cutoff threshold indicates evidence that the variables are correlated.
Enter any number for r between -1 and 1 and the degrees of freedom (which is n-2) for your study to calculate the P value from r.
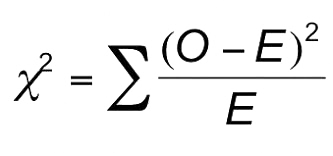
What is chi-square?
Chi-square is used to compare counts within grouped data. The two most common uses are contingency tables and comparing observed data to any given expected distribution.
The formula for chi-square involves a few steps, summing the results of an expression to compare observed (O) and expected (E) values.
Here is an example of a chi-square calculator to compare expected and observed frequencies.
You can use this page to calculate the P value from chi-square values of your choice (and the correct degrees of freedom). Only positive values of chi-square are appropriate. Learn more about interpreting P values for chi-square (scroll to the bottom of the link).
Limitations of P values
As convenient as the "significant or not" P value threshold is, it does not always paint a full picture of the analysis for a few reasons:
- They can be confusing to interpret. Sometimes a study's small sample size causes an insignificant result when the null hypothesis should be rejected.
- P values can be "hacked" to give a significant result when one doesn't actually exist, leading to unreproducible research. Other times researchers approach hypothesis testing backwards, by letting the P value decide the hypothesis after the fact.
- Confidence intervals give a range of possibilities that are more informative than a P value.
- Outliers are not automatically detected, as they would be with a simple chart.
Despite its reputation as the ultimate endpoint in most studies, P values are not as important as a well-designed experiment and a keen eye for nuance in the data.
Next steps
These calculators can reduce the confusion that comes with tables and are good for quick analysis.
Software like Prism helps simplify your entire analysis, from choosing the right test, to identifying outliers, to creating publication-quality graphics. We offer a free 30-day trial of Prism.
Analyze, graph and present your scientific work easily with GraphPad Prism. No coding required.