High R2 but useless results: Dependency and ambiguous fits.
Example of a nonlinear fit that goes near the points but is not useful
When you first look at this log(dose) vs. response curve, it looks fine. The curve comes close to the points, and so has a high R2 value ( 0.997).
But viewing the results table reveals three problems:
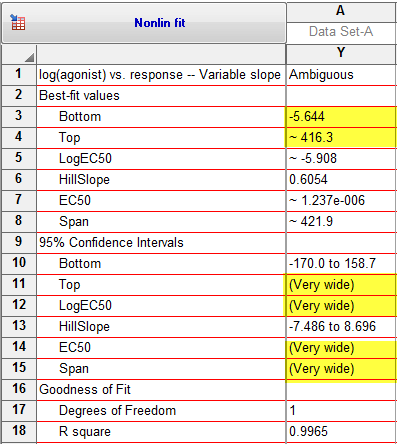
- Prism labels the fit ‘ambiguous’.
- Instead of reporting the confidence interval of some parameters, it simply reports "very wide".
- The best-fit value of the EC50 (1200 nM) can’t be correct. It is higher than any of the X values.
To understand the problem, you first need to learn about the term ambiguous and the concept of dependency.
The term "ambiguous"
Prism labels a curve fit as 'ambiguous' when the parameters are completely intertwined or redundant. This means that there are many ways to generate essentially the same curve with the same R2. As you can see in the results above, when Prism reports that a parameter is 'ambiguous' (there may be one or several), Prism places '~' before the best fit value and standard error, and reports "very wide" for the confidence interval. This shows you that the best-fit value of an ambiguous parameters is virtually meaningless, as is its standard error.
If your goal is to interpret or compare the best-fit parameter values, an ambiguous fit is useless. On the other hand, the curve may be quite useful if your goal is to interpolate values from a standard curve (so long as all your unknowns are within the range of the standards, so you are interpolating -- not extrapolating).
The problem of intertwined parameters is intrinsic to nonlinear regression. Using the term "ambiguous" to warn about meaningless parameter values is, however, unique to GraphPad Prism.
The concept of dependency
The degree to which a parameter is intertwined with other parameters is quantified with a value called the dependency. Each parameter has a distinct dependency (unless there are only two parameters, in which case both dependencies are the same). The value of dependency is always between 0.0 and 1.0.
To understand the meaning of dependency, you need to think about models and equations. The curve is defined by an equation that uses the best-fit values of the parameters. If you change the value of one parameter away from its best-fit value, while holding the other parameters constant, the curve will move further from the data. The sum-of-squares will increase and the R2 will decrease. But you may be able to reverse these effects by adjusting the values of other parameters. The dependency quantifies the degree to which it is possible to move the curve back to be near the points again. If changing the value of other parameters cannot move the curve at all closer to the points, then the dependency of the first parameter you changed is defined to equal 0.0. If changing the value of the other parameters can move the curve back so it is just as close to the points as the original curve, then the dependency equals 1.0. With actual data, of course, the dependency or each parameter is between these two extremes. Read details about how dependency is computed.
To ask Prism to report dependency, check an option on the Parameters tab of the nonlinear regression dialog.
There is a simple relationship between dependency and the term ambiguous. When the dependency is greater than 0.9999, Prism labels the fit "ambiguous". Of course, that threshold is arbitrary.
When to suspect high dependency
Suspect that the dependency might be high when a best-fit value of a parameter seems wrong, when the confidence interval of a parameter is wider than you expect, or when its standard error is larger than you expect. In these cases, go to the Diagnostics tab of the Nonlinear regression dialog and check the option box to report the Dependency.
If the dependency of any parameter is high, you know that you are asking Prism to fit more parameters than the data and model really define. How high is high? Any rule of thumb is arbitrary, but be suspicious of any dependency greater than 0.95, and very suspicious of any dependency greater than 0.99.
How to salvage this fit
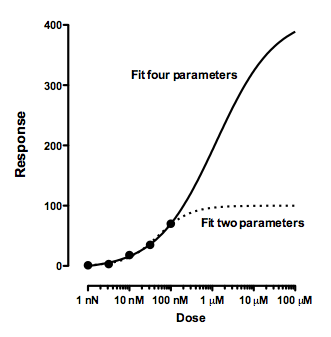
In the example shown at the top of this page, Prism was asked to fit all four parameters that define a dose-response curve: the bottom plateau, the top plateau, the EC50 (middle) and the Hill Slope (steepness). But the data don’t even give a hint of a top plateau. The best-fit curve shown has an EC50 of 1.2 μM (far to the right of the concentrations used) and a Top plateau of 416 (much higher than any observed value).
Since these Y values represent responses normalized to run from 0% to 100%, the results shown above make no sense. But Prism can’t know that. All Prism can do is report that the dependency is high and the confidence intervals are wide.
One way to fix the problem would be to do the experiment again, with data at higher concentrations.
But it is easy to salvage this experiment, without collecting more data. Go to the Constraints tab and force Bottom to equal 0 and Top to equal 100. Now you are only asking nonlinear regression to fit two (rather than four) parameters. The best-fit EC50 drops to 49 nM with a 95% confidence interval ranging from 39 to 63 nM. The dependency of the log(EC50) parameter is now only 0.05. This revised fit is quite useful. All it took was imposing constraints so the nonlinear fit matched the experimental setup.
The resulting curve (dotted curve below) is nearly identical to the original curve (solid) within the range of the data. It comes closer to some points but is further from others. However, the two curves make wildly different predictions at higher concentrations. This graph highlights why the four-parameter fit is ambiguous. The data simply don't define the top plateau of the curve, and any attempt to find the top via curve fitting will lead to ambiguous results.