Goodness-of-fit metrics for Cox proportional hazards regression can be grouped into two main categories. Explore each of these categories below for more information on the metrics that are reported by each.
Hypothesis tests
Prism offers a number of different tests and metrics that it can report after performing Cox proportional hazards regression. Three of these options are in the form of hypothesis tests, each with their own unique null hypothesis. These tests are:
•Partial likelihood ratio test
•Wald test
•Score test
The mathematics used to perform these tests is rather complicated, heavily relying on the likelihood function that is also used to determine the best-fit values of the model parameter coefficients (the estimated β values). However, each of these tests use similar null hypotheses that assume that none of the predictor variables provide any information to help estimate the hazard (or survival) in the regression model. In other words, these tests compare two regression models:
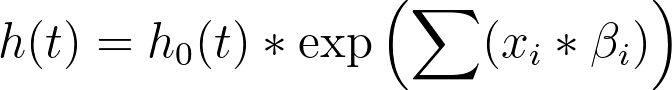
•The model specified in the Model tab:
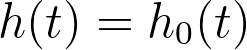
•The null model (the model with no covariates/predictor variables):
The test statistic for each of the three tests are slightly different, but are all evaluated similarly. Specifically, each test generates a chi-square statistic, and a corresponding P value that represents the probability of obtaining a test statistic value as large or larger than the one calculated, assuming that the null hypothesis (all beta values are zero) is true. For these tests, a small P value would indicate that the null value should be rejected, or that the null model is insufficient to describe the observed data.
Concordance statistics
Prism offers the option to report Harrell’s C statistic for concordance. For specific information on how this statistic is calculated, more information is provided in the results interpretation section of this guide for Cox proportional hazards regression.
The main idea behind concordance is to summarize how well the specified model performs at predicting the survival (elapsed time prior to the event of interest) for any observation in the input data. To accomplish this, every possible pair of observations is considered. For each pair of observations, the known elapsed times to the event of interest are compared, and the estimated hazard ratios for each of the observations are compared. The C statistic is the percentage of these pairs for which the observation with the larger estimated hazard ratio is also the observation with the shorter observed elapsed time to the event of interest.
The C statistic can take on any value between zero and one. A value of one indicates that the model correctly predicted a longer survival time (smaller hazard ratio) for every pair of observations. A C statistic of 0.5 indicates that the model correctly predicts only 50% of the observation pairs, meaning the model does no better than random chance (a “coin flip”). Values less than 0.5 suggest that the model is doing worse than random chance, suggesting that some constraint in the model may need to be reconsidered.
This concept may seem similar to the goodness-of-fit metric for logistic regression of the area under the ROC curve. In fact, the C statistic and the AUC of the ROC curve for logistic regression are equivalent.